
Fig. 1.
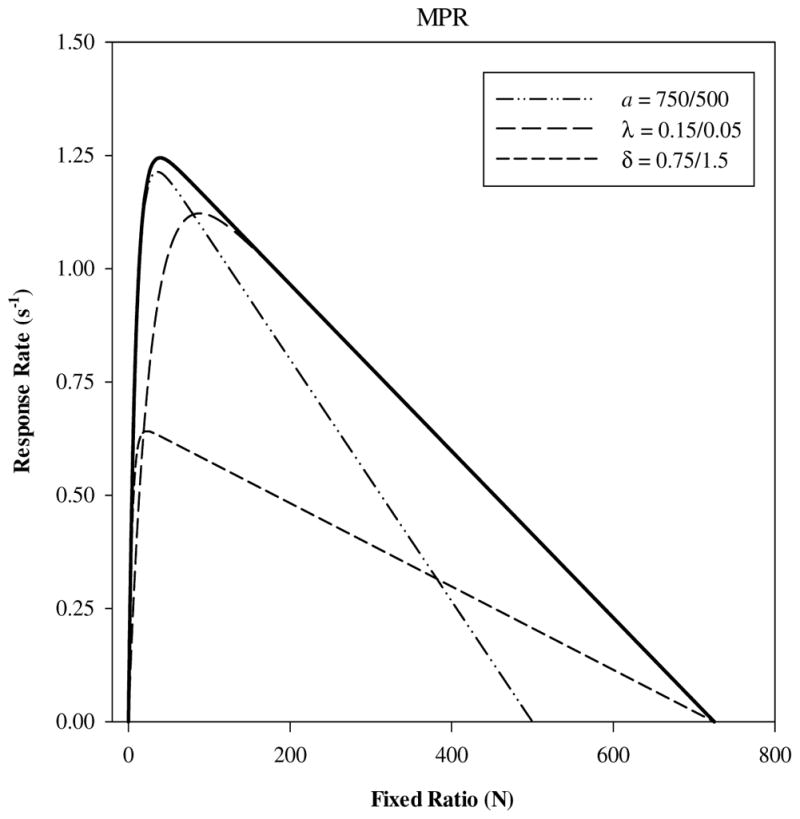
Predicted overall response rate (s−1) plotted as a function fixed ratio schedule by MPR (Eq. 1). The thick reference line represents predictions with a = 750, λ = 0.15, and δ = 0.75, respectively. Each dashed line indicates the changes in the shape of the predicted function given the change in one parameter as indicated at the right of the forward slash. The change in a = 750/500 (dot-dot-dash) corresponds to a less valued reinforcer that produces a lower break point and intercepts the x-axis at a smaller fixed ratio. The change in λ = 0.15/0.05 (long dash) corresponds to a decrease in the rate at which working memory saturates and a larger fixed ratio when the peak of the rate function is reached. The change in δ = 0.75/1.5 corresponds to an increase in the minimum response time and a decrease in the peak response rate from 1.3 to .66 responses s−1.