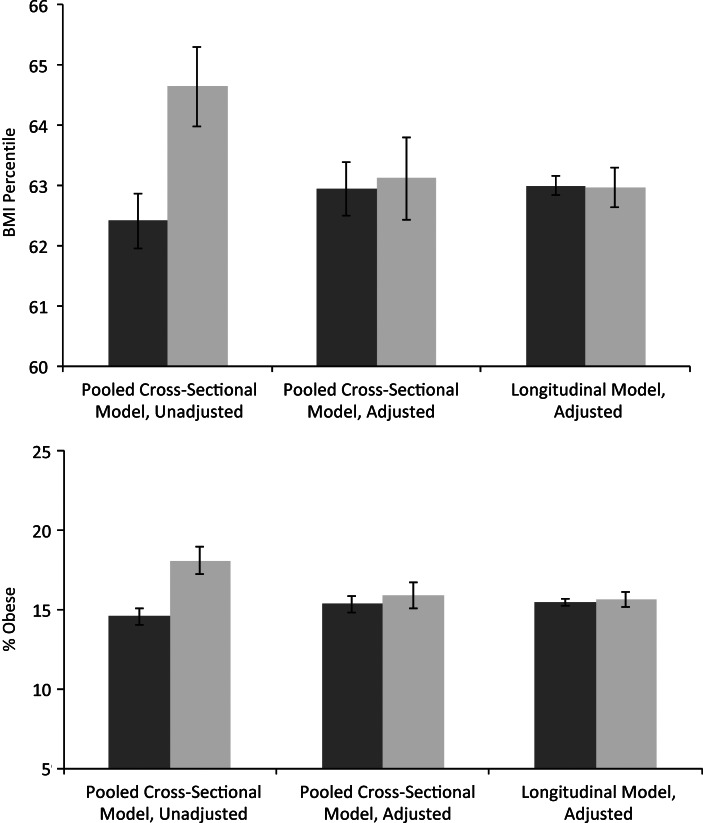
Figure 2.
Estimated relationship between parent-perceived neighborhood safety and children's body mass index (BMI; weight (kg)/height (m)2) percentile (top) and obesity (bottom) in pooled cross-sectional and longitudinal models, United States, 1999–2007. Dark gray columns indicate a neighborhood perceived as safe; light gray columns indicate a neighborhood perceived as not safe. Bars, 95% confidence interval.

