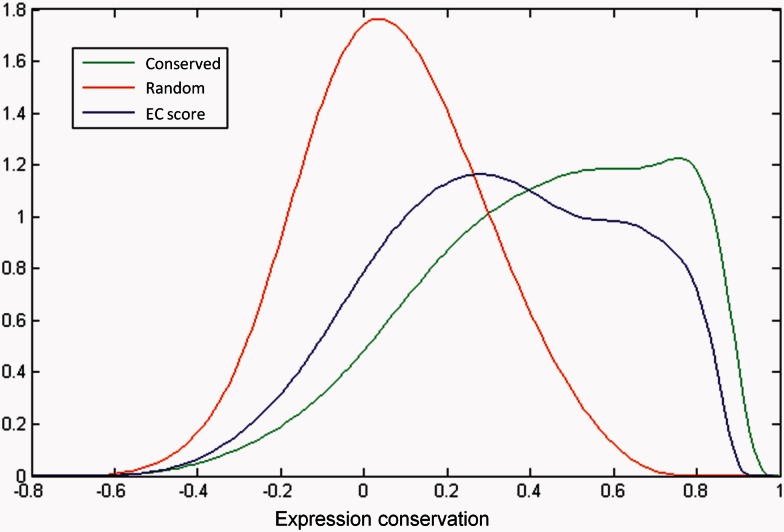
Fig. 1.
Distribution of the EC score between the orthologous genes of Escherichia coli and Salmonella enterica serovar Typhimurium depicted by its kernel smoothed density estimate (blue line). The distribution of the EC scores for gene pairs with randomized expression values, which represent the estimated score given no conservation of expression, is shown as a red line. The distribution of the EC scores resulting from comparison of the E. coli compendium to itself with data from different experiments is shown as a green line and represents the estimated score given perfect conservation of expression.

