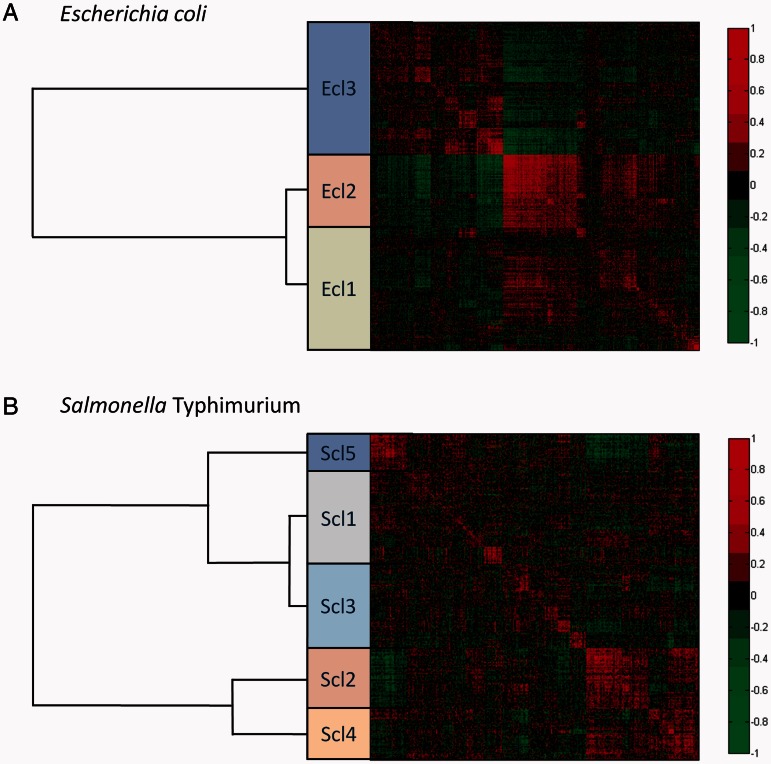
Fig. 2.
Expression correlation matrices of the genes in the core genome of Escherichia coli (A) and Salmonella enterica serovar Typhimurium (B). Each value presented in the heatmap is the Pearson correlation coefficient between the expression profile of the gene in the row and the expression profile of the gene in the column from the compendium of the given species. The rows and columns are sorted according to a hierarchical clustering, and functional expression classes were created at a cutoff of 110 distance units. The classes are represented by colored boxes with their hierarchical relationship given in the tree to the left. Each class is labeled E. coli class (Ecl) or S. Typhimurium class (Scl) appended by a number.

