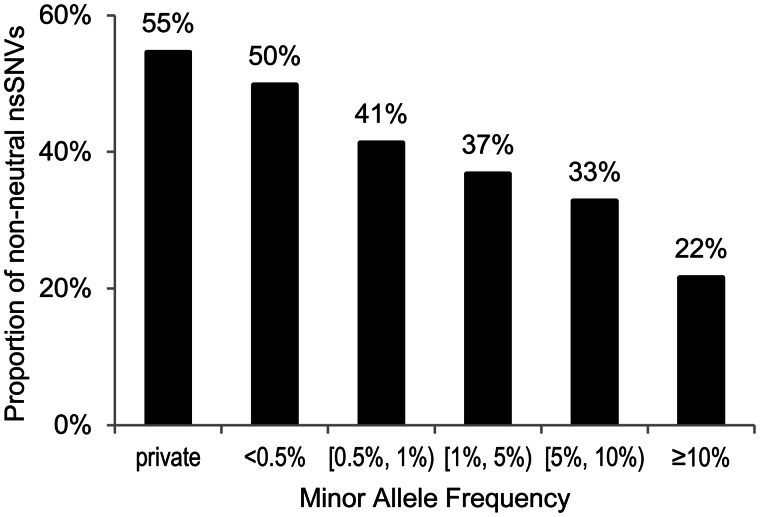
Fig. 4.
Analysis of population variation data. Proportions of nsSNVs diagnosed to be non-neutral by using complete concordance approach (solid lines) in different maf categories. A total of 240,625 nsSNVs from the ESP5400 Project were analyzed (Tennessen et al. 2012). Private nsSNVs are those observed only once in the population. The other maf categories contain nonprivate nsSNVs. A negative correlation was observed between maf and proportion of nsSNVs diagnosed to be non-neutral (percentages displayed above columns).

