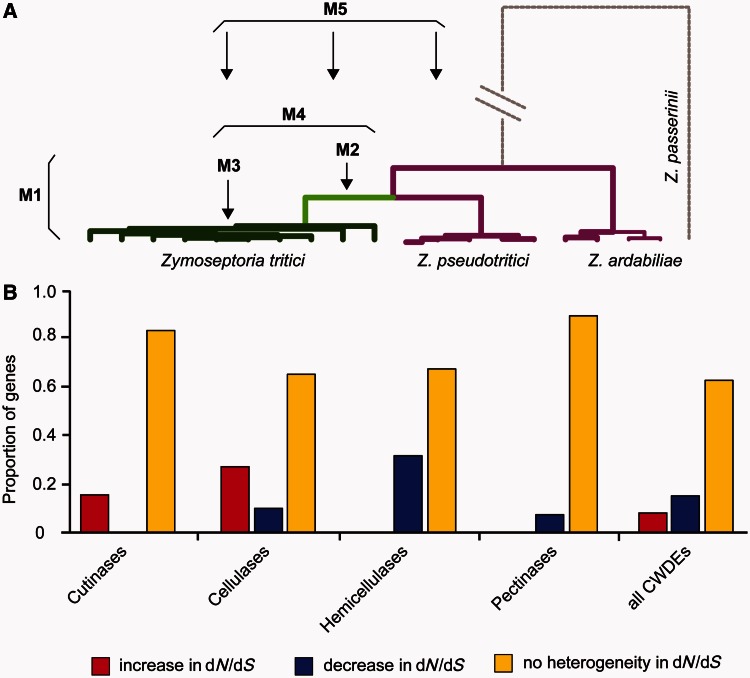
Fig. 3.
Likelihood ratio tests to detect selection heterogeneity across the phylogeny of Zymoseptoria tritici against its ancestors for all 48 cell wall degrading enzymes. (a) Phylogeny and models used to assess heterogeneity in dN/dS. Models M2–M5 assume heterogeneity on different levels and are compared against the null-model M1 assuming a constant dN/dS value. (b) Gene frequencies of significantly higher dN/dS ratios (red) or significantly lower dN/dS ratios (blue) for Z. tritici at P ≤ 0.01. Nonsignificant selection heterogeneity is indicated in yellow. Detailed values are given in supplementary table S4, Supplementary Material online.

