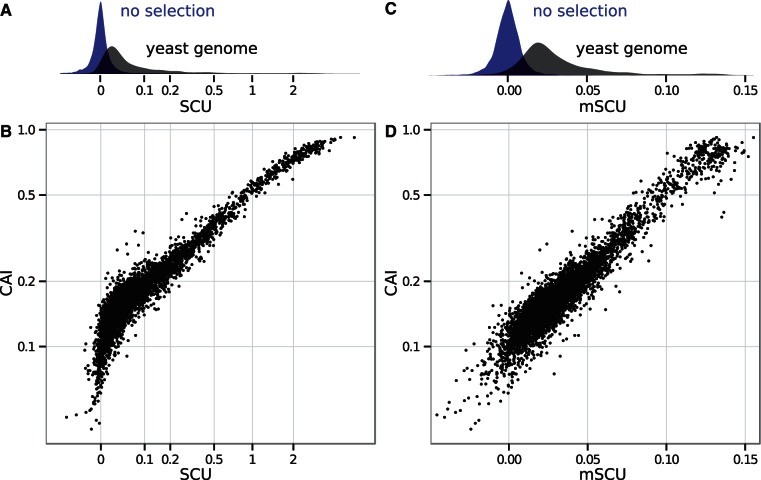
Fig. 7.
Genewise estimates of translational selection in budding yeast. SCU measures the per-codon average selective advantage of a gene relative to an unselected gene (see text), and mean selection per codon mSCU measures the per-codon per-transcript selective advantage. (A) Distribution of SCU values for all budding yeast genes compared with unselected genes, generated with identical amino acid counts and model-estimated mutation biases absent selection. These distributions partially overlap, suggesting that codon usage in some genes is driven primarily by selection and in others primarily by mutation bias. Because SCU varies over orders of magnitude, yet has negative values, we have plotted it on a scale transformed by  . (B) SCU values for all budding yeast genes compared with CAI, a popular metric of codon usage bias. Each point represents one gene. (C) Distribution of mSCU values across the yeast genome compared with those generated with identical amino acid counts and model-estimated mutation biases but without selection. (D) mSCU compared with CAI. The relationship between mSCU and
  is close to linear (
 ).
).

