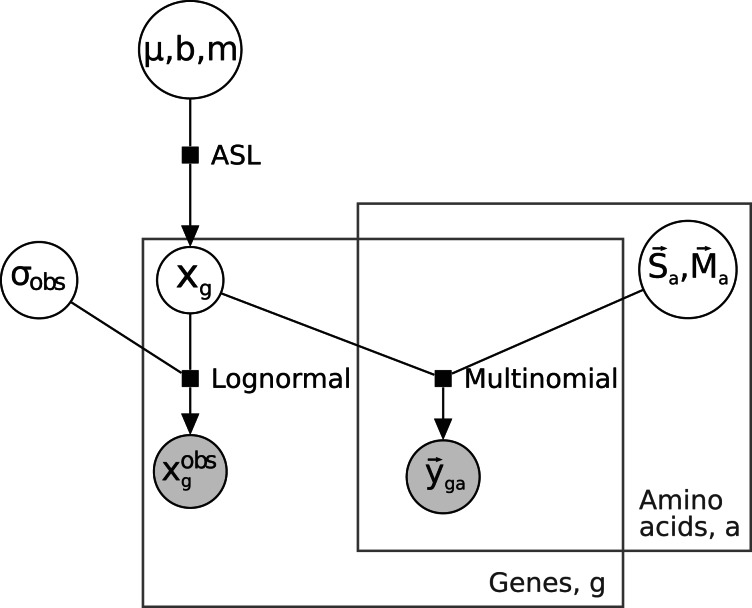
Fig. 8.
Graphical representation of model. The representation as a probabilistic graphical model (Airoldi 2007) uses shaded circles to indicate observed quantities, and plain circles to indicate unobserved quantities; plates (gray rectangles) indicate that the likelihood factors both by gene and by amino acid. The three black squares represent the three components of the model discussed in the text and Materials and Methods.

