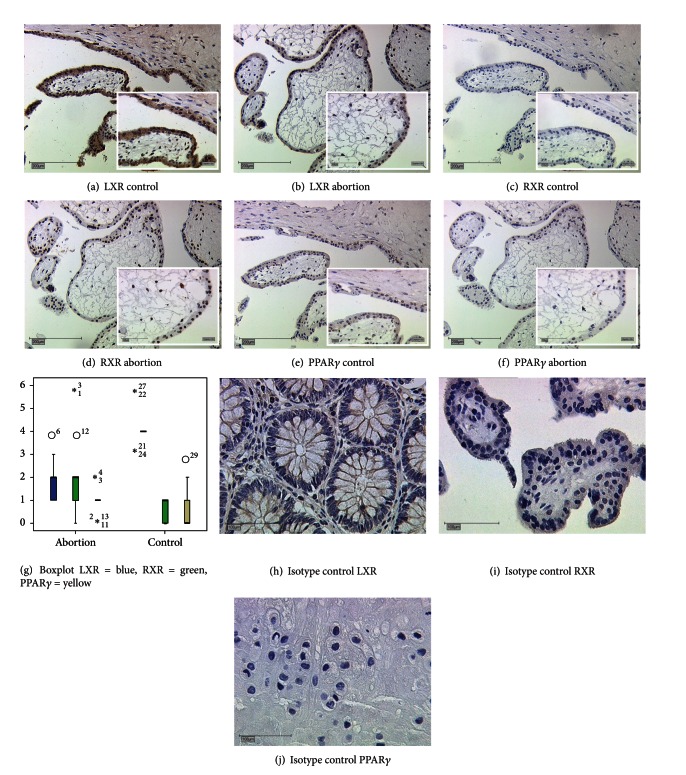
Figure 3.
Serial sections of LXR ((a), (b)), RXRα ((c), (d)), and PPARγ ((e), (f)) expression in the syncytiotrophoblast of placentas from regular pregnancies ((a), (c), (e)) and in placenta of miscarriage ((b), (d), (f)). All magnifications are 20x lens. Box plots represent the LXR, RXRα and PPARγ expression in the placental syncytiotrophoblast of spontaneous abortion and control placentas derived from serial sections (g). (h), (i), (j) show isotype control for LXR, RXRα, and PPARγ. The boxes display the range between the 25th and 75th percentile and the horizontal line indicates the median. The bars represent the 5th and 95th percentiles. Circles indicate values which are more than 1.5 times the box length. Asterisks indicate values which are more than 2 times the box length.

