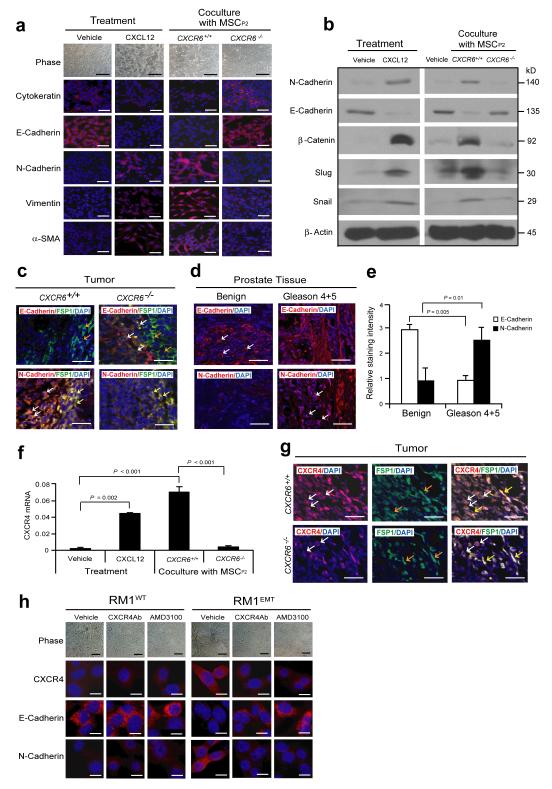
Figure 4. CAF-mediated CXCL12 promotes EMT in primary tumor.
(a) Vehicle or CXCL12 treated RM1 cells, or RM1 cells co-cultured with MSCs from CXCR6+/+ or CXCR6−/− mice were examined by phase contrast microscopy and IHC staining for cytokeratin, E-cadherin, N-cadherin, vimentin, and α-SMA. Scale bars, 100μm. Representative images from 2 independent studies. (b) Western blots analysis for epithelial (E-cadherin) and mesenchymal (N-cadherin, β-catenin, snail, slug) markers. Representative images from 2 independent studies. (c) EMT markers in the primary tumor were examined by IHC. Colocalization of E-cadherin or N-cadherin with FSP1 was observed. More E-cadherin by prostate cancer cells (red; white arrows) was detected in close proximity to FSP1 expressing MSC cells (green; orange arrows) in tumors grown in CXCR6−/− mice compared to tumors grown in CXCR6+/+ mice. In contrast, more N-cadherin expressing prostate cancer cells (red; white arrows) were detected in close proximity to N-cadherin and FSP1 co-expressing CAF cells (yellow; yellow arrows) when the tumors were grown in CXCR6+/+ mice compared to tumors grown in CXCR6−/− mice. Blue, DAPI nuclear stain. Scale bars, 100μm. Representative images derived from n=10 mice/group). (d) IHC of E-cadherin or N-cadherin positive cells within benign or Gleason 4+5 prostate cancers in human prostate tissue microarrays (TMAs) (red, E-cadherin or N-cadherin, white arrows; blue, DAPI nuclear stain). Scale bars, 100μm. (e) Quantification of Fig. 4d. Mean expression scores were multiplied by percent positive cells in the field. Significant differences were noted between benign (n = 30) or Gleason 4+5 prostate (n = 6) (mean±s.d ANOVA). (f) CXCR4 mRNA was determined for EMT-induced RM1 cells following CXCL12 treatment or co-culture with MSCs derived from CXCR6+/+ or CXCR6−/− mice (mean±s.d., n = 3 independent experiments). (g) More CXCR4 expressing RM1 cells (red; white arrows) were detected in close proximity to CXCR4 and FSP1 (green; orange arrows) co-expressing CAF cells (yellow; yellow arrows) when the tumors were grown in CXCR6+/+ mice compared to tumors grown in CXCR6−/− mice. Scale bars, 100μRepresentative images from an experiment with n=10 animals/group). (h) AMD3100 or anti-CXCR4 antibody prevents the development of EMT by RM1 cells following CXCL12 exposure. Scale bars, 100μm. Representative images from an experiment with n=10 animals/group.

