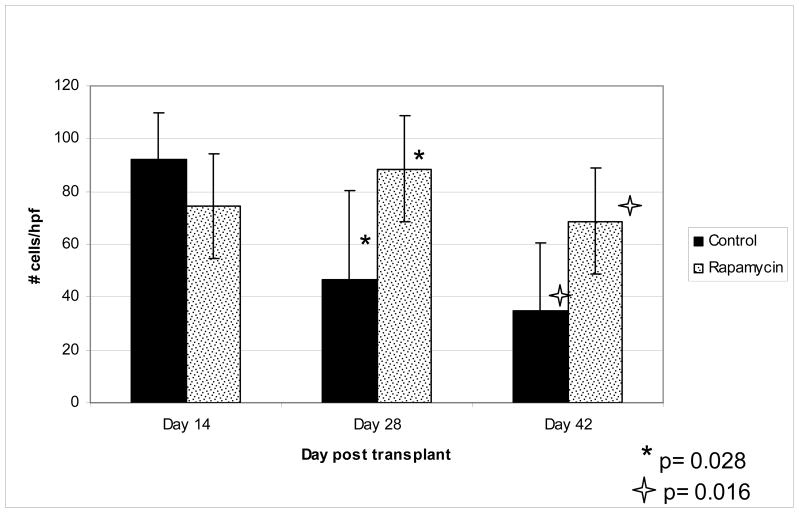
Figure 3. Infiltrating nucleated cells per high power field.
H&E stained biopsies were evaluated for cellular infiltrate. Shown is infiltrating cells per high powered field. 10 hpf or maximum possible was counted and average calculated. In control group the following number of slides were analyzed: Day 14, n=5; day 28, n=7; day 42, n=6. In RAPA group the following number of slides were analyzed: Day 14, n=6; day 28, n=6; day 42, n=6.

