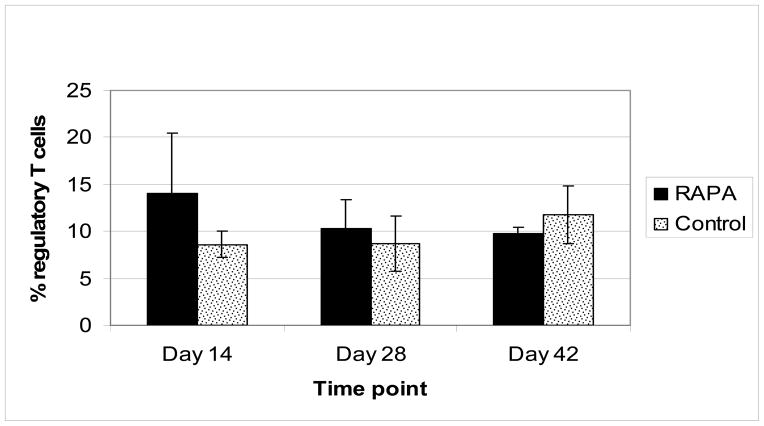
Figure 6. Percent FoxP3 positive cells per CD4+ cells in peripheral blood.
Peripheral blood was obtained on day 14, 28 and 42 and analyzed via FACS analysis. Above represents FoxP3 positive cells as a percentage of total CD4+ cells. No significant difference was observed between groups. In control group the following number samples were analyzed: Day 14, n=5; day 28, n=7; day 42, n=6. In RAPA group the following number of samples were analyzed: Day 14, n=6; day 28, n=6; day 42, n=6.

