
Figure 2.
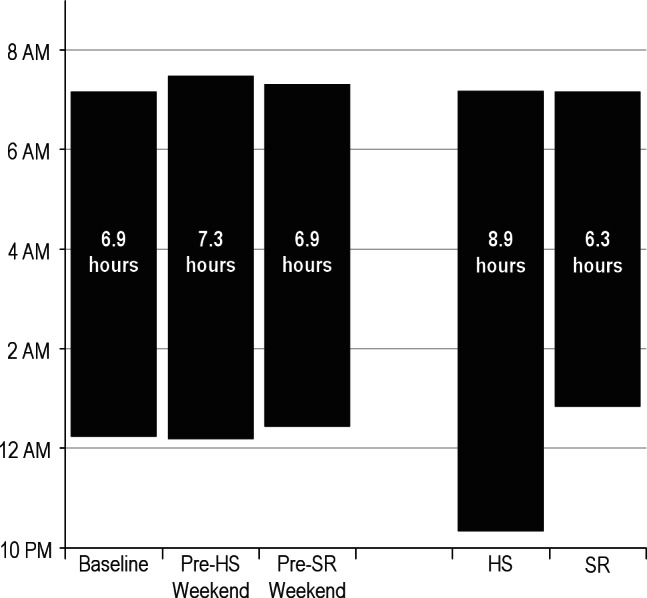
Average sleep patterns, as estimated by actigraphy, for the baseline condition, the weekends that preceded each experimental condition, and each experimental condition (SR, sleep restriction; HS, healthy sleep condition). Mean sleep onset time is marked by the bottom of each bar, and sleep offset by the top of each bar. Mean sleep duration is printed within each bar. The baseline and weekend sleep durations did not significantly differ (P > 0.05) but collectively were significantly shorter than the HS condition (P < 0.001) and longer than the SR condition (P = 0.001). The adolescents averaged 2.53 h (SD = 0.68) more sleep during the HS condition than the SR condition (P < 0.001) due to changes in sleep onset (P < 0.001) without differences in wake times (P = 0.561).