
Figure 2.
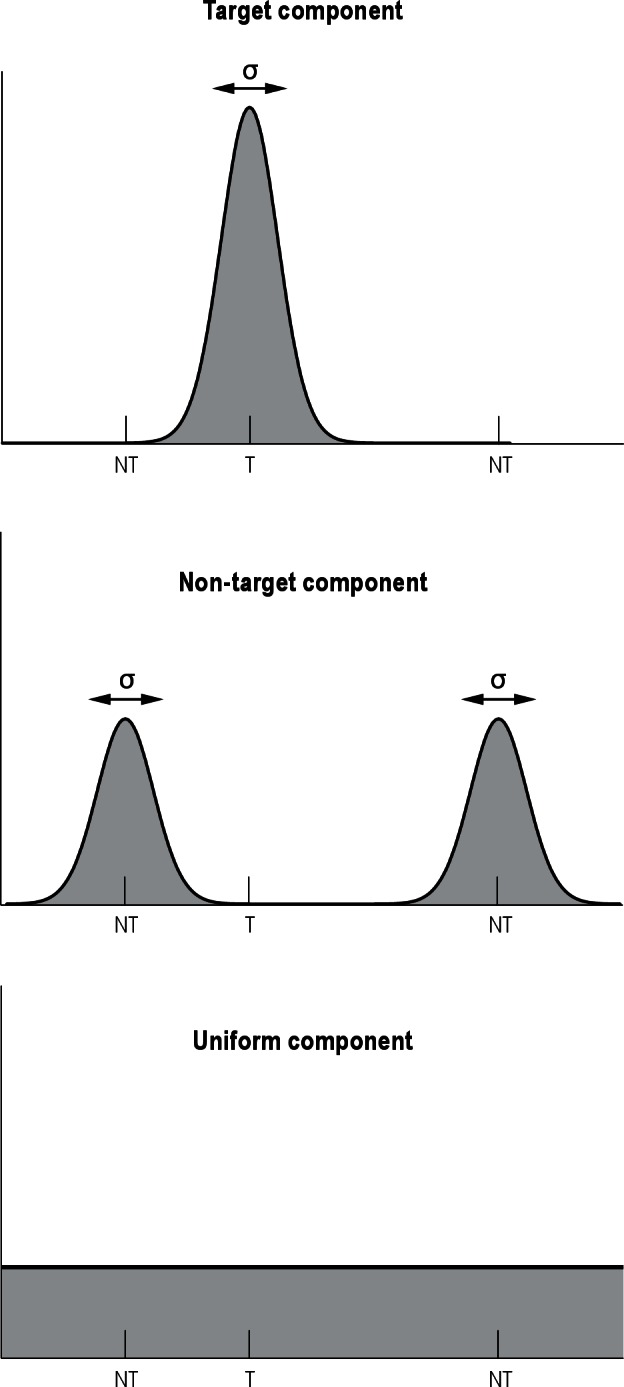
Components of error in the color recall task.53 The response distribution is assumed to comprise a mixture of three distributions: A von Mises distribution with variability σ (converted from κ; see text) around the target (T) color (top), von Mises distributions with variability σ around each of the nontarget (NT) colors (middle), and a uniform distribution across the response space (bottom). The figure represents hypothetical response distributions for each component. Note that the distances between the target and nontarget items varied across trials; the figure shows an example.