
Figure 2.
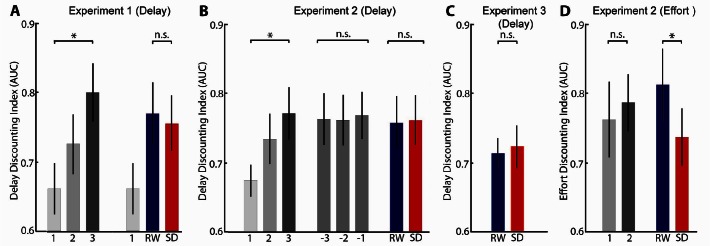
Discounting indices (area under the curve, AUC) for all experimental sessions. A high AUC denotes low discounting, a low AUC denotes high discounting (A) Experiment 1. Left: Delay discounting index during briefing session 1 (light gray), session 2 (gray) and session 3 (dark gray). Right: Delay discounting index during briefing session 1 (light gray), in RW: rested wakefulness (blue) and SD: sleep deprivation (red). (B) Experiment 2. Left: Delay discounting index in the first three consecutive sessions: briefing session 1 (light gray), session 2 (gray) and session 3 (dark gray). Middle: Delay discounting index in the three sessions prior to the RW and sleep deprivation sessions (-3, -2, -1; gray). Right:Delay discounting index in RW (blue) and sleep deprivation (red). (C) Experiment 3. Delay discounting index in RW (blue) and sleep deprivation (red). (D) Experiment 2. Left: Effort discounting index in session 1 (gray) and session 2 (dark gray). Right: Effort discounting index in RW (blue) and sleep deprivation (red). Error bars represent the standard error from the mean. n.s., not significant; asterisk denotes P < 0.05.