
Figure 2.
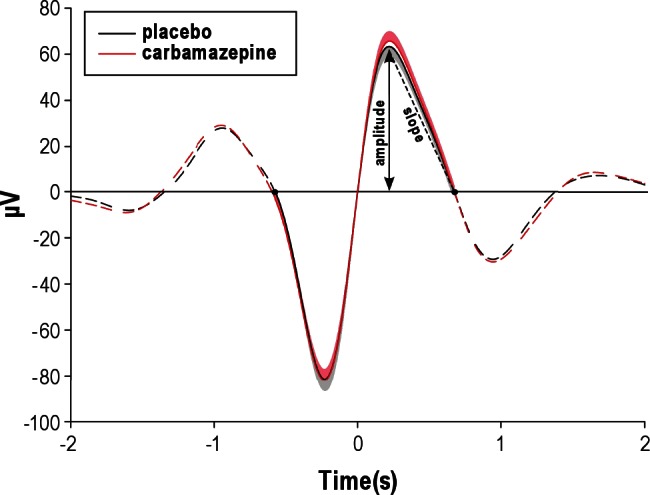
Mean (± standard error of the mean) time course of selected successive slow oscillation negative half-waves and positive half-waves time locked to the zero-crossing between negative and positive half-waves. The peak of the positive half-wave and the positive-half-wave downward slope are indicated. Black dots along the line at 0 μV demarcate beginning and end of the selected successive half-waves. Dashed lines represent the means of all previous and subsequent electroencephalographic activity.