
Figure 4.
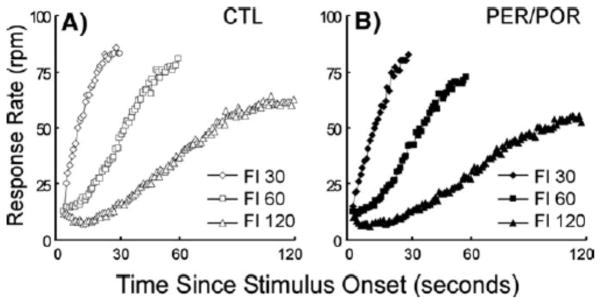
Response rates for the MCI task plotted against time. Rates are shown for the control (A) and lesioned (B) groups. There were no differences between groups in the ability to associate a discrete cue with a duration in this concurrent discrimination task using cues similar to those in the FPFN task except that there were no compound cues.