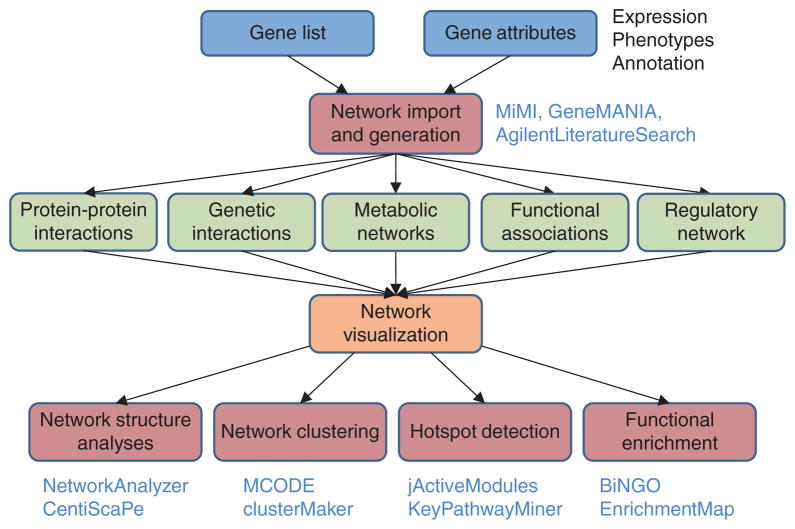
Figure 2.
Network analysis workflow. Specific genes or attributes (blue) typically gathered in preparation for network analysis are imported and used for network generation (red). Many different types of networks are available (green) for import, after which Cytoscape visualization enables users to efficiently explore and biologically interpret the network65 (orange). Subsequent network analysis invokes computational algorithms or statistics to interpret and organize interactions (red). Commonly used plugins associated with each level are listed.

