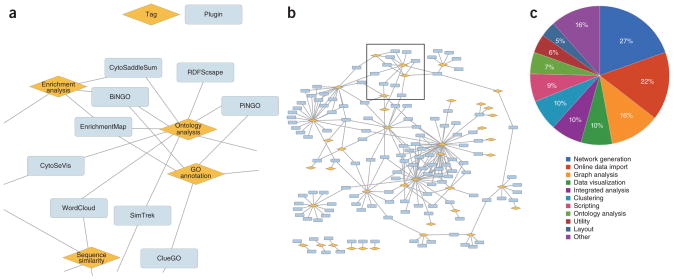
Figure 3.
Relationships between Cytoscape plugins and tags. (a,b) Zoomed figure (a) and wide view (b) of relationship map. Orange diamonds, tags; blue rectangles, plugins. The full map of the plugin tags can be found in Supplementary Figure 1. (c) Percentages of plugins with indicated tags. A plugin is counted once for each tag assignment; it is counted multiple times if it is assigned multiple tags. Note that only plugins which passed our basic validation test are shown.

