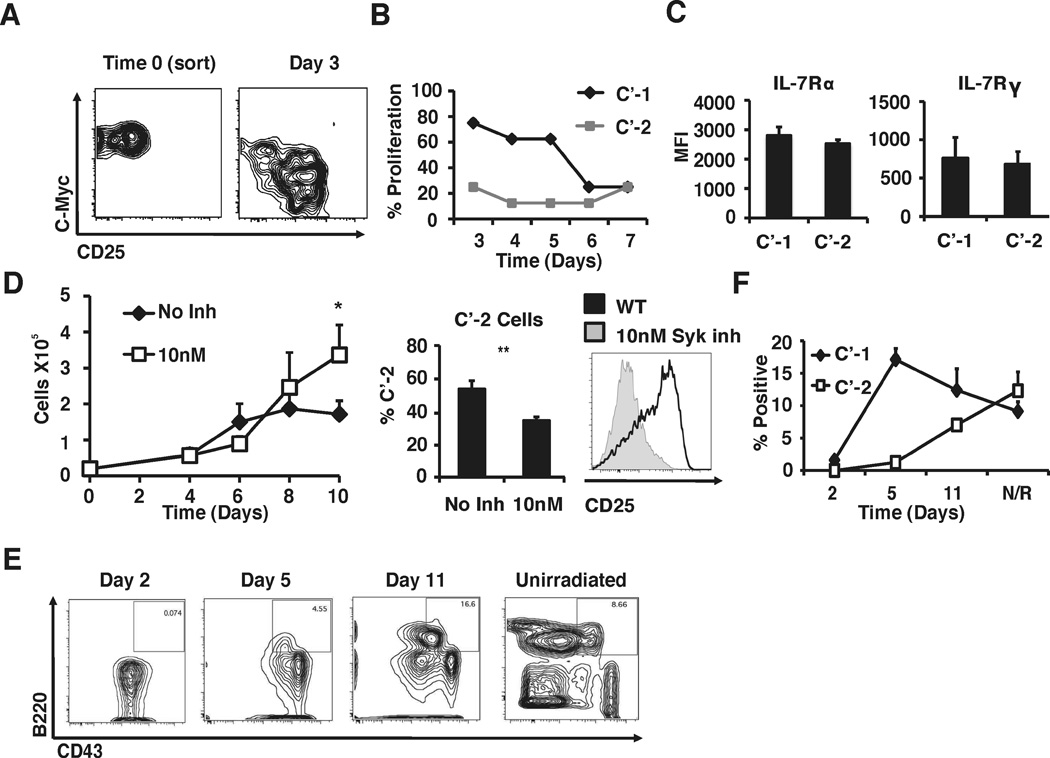
Figure 3. Functional and precursor-product relationship analysis of C’-1 and C’-2 cells.
(A) C’-1 cells were sorted via FACS and then co-cultured with OP-9 stromal cells supplemented with IL-7. After 3 days in culture, cells were analyzed by flow cytometry to assess differentiation into C’-2 cells. Data shown is representative of 5 independent experiments (n=8). (B) Freshly isolated C’-1 and C’-2 cells were directly FACS sorted at 10 cells/well into microtiter plates and co-cultured with OP-9 stroma in the presence of 10ng/ml IL-7. Wells were scored daily to determine IL-7-induced proliferation by microscopic observation. Data is representative of 2 independent experiments (n=4). (C) Flow cytometry analysis of IL-7Rα and cγ in C’-1 and C’-2 cells. MFI is shown, data is composite of 3 independent experiments (n=6). (D) Analysis of pre-B cell proliferation in the presence of Syk kinase inhibitor (BAY61-3606). B220+/CD43+/CD25− cells were FACS sorted and cultured in the presence of indicated concentrations of IL-7, with or without BAY61-3606 (10nM). Cells were counted every 2 days and analyzed for CD25 expression on day 10. Data is composite of 4 independent experiments (n=6). (E) Autoreconstitution analysis of pre-B cell repopulation kinetics. c-MyceGFP/eGFP mice were sublethally irradiated (500 rads) and pro/pre-B cell populations were analyzed as indicated. (F) Percent of C’-1 and C’-2 cells were measured as well as total B220+/CD43+ populations. Data is representative of 4 independent experiments (n>10).

