
Figure 7.
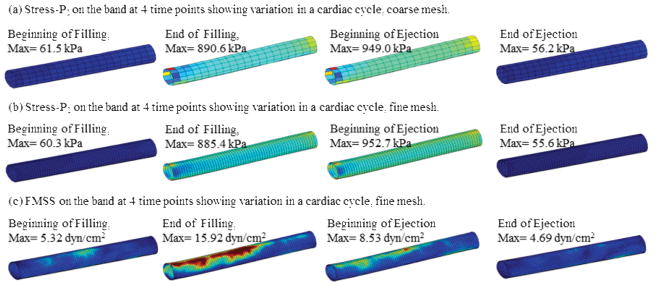
Plots of band Stress-P1 and flow maximum shear stress (FMSS) showing band stress and FMSS variations in a cardiac cycle.
Official websites use .gov
A
.gov website belongs to an official
government organization in the United States.
Secure .gov websites use HTTPS
A lock (
) or https:// means you've safely
connected to the .gov website. Share sensitive
information only on official, secure websites.
Plots of band Stress-P1 and flow maximum shear stress (FMSS) showing band stress and FMSS variations in a cardiac cycle.