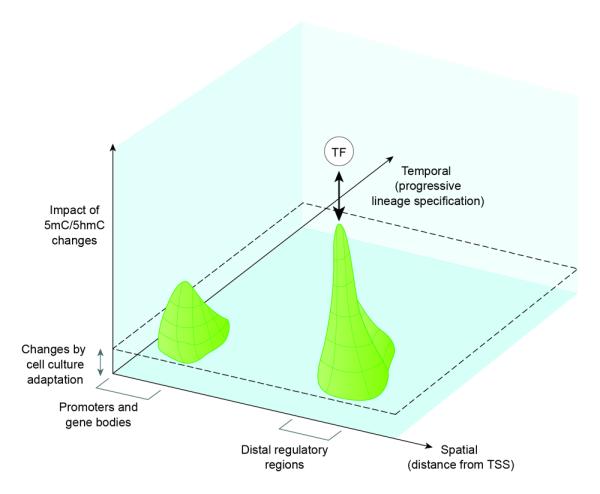
Figure 4.

Schematic plot of the significance of 5mC/5hmC changes against a spatial axis of genome location and against a temporal axis of progressive lineage specification. The contour plot depicts a tall peak at distal regulatory regions and a lower peak at promoter and gene bodies along the spatial axis, indicating that the influence of cell type-specific dynamic changes in DNA methylation on lineage-specific gene expression is strongest at distal sites. These peaks align at an early time window along the temporal axis of increasing lineage commitment (or decreasing multilineage potency), indicating that most DNA methylation changes occur early when cells exit pluri- or multi-potency during the course of differentiation. In the “fourth” dimension, cell type specific transcription factors are shown above the DNA methylation contours to indicate that binding of transcription factors at distal regulatory elements influences DNA methylation status locally. The raised level indicated by the dotted lines denotes possible DNA methylation “artifacts” introduced by culture adaptation of cells and long-term passaging in vitro.
