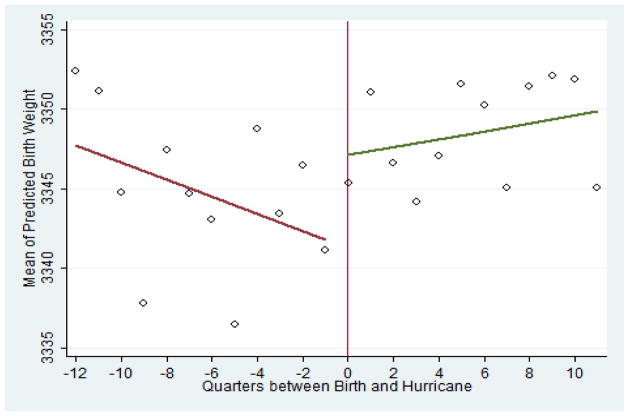
Figure 2. Predicted Birth Weight by Quarters from Hurricane Occurrence.
Notes: See notes under Table 1 for more information on the main sample of analysis. The sample is limited to births within a 30km radius of any hurricane path. This figure plots average predicted birth weight by number of quarters between the birth and storm/hurricane occurrence. Birth weight is predicted using an OLS model on a base sample that excludes hurricane time periods (only the following time periods are included in the base sample: 1/1996–7/1998, 9/2000–5/2001, 7/2002–6/2003, 8/2004–8/2005, 10/2005–6/2008). The following covariates are included in the prediction model: mother’s race, mother’s age, mother’s education, mother’s marital status, birth parity, and conception month indicators.

