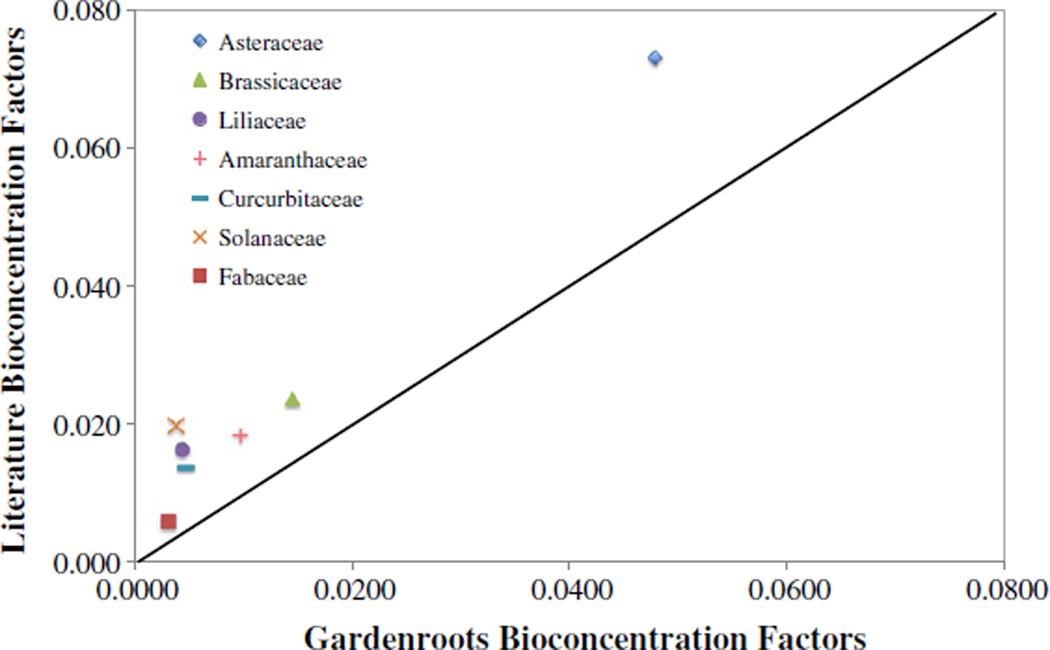
Fig. 5.
A comparison of the average bioconcentration factor values for the current Gardenroots study and the literature values. The solid line represents a one-to-one relationship. Points above the line show plant families that have higher literature BCF values than Gardenroots values. Vice versa, points below the line would show plant families that have lower Gardenroots BCF values than literature values.

