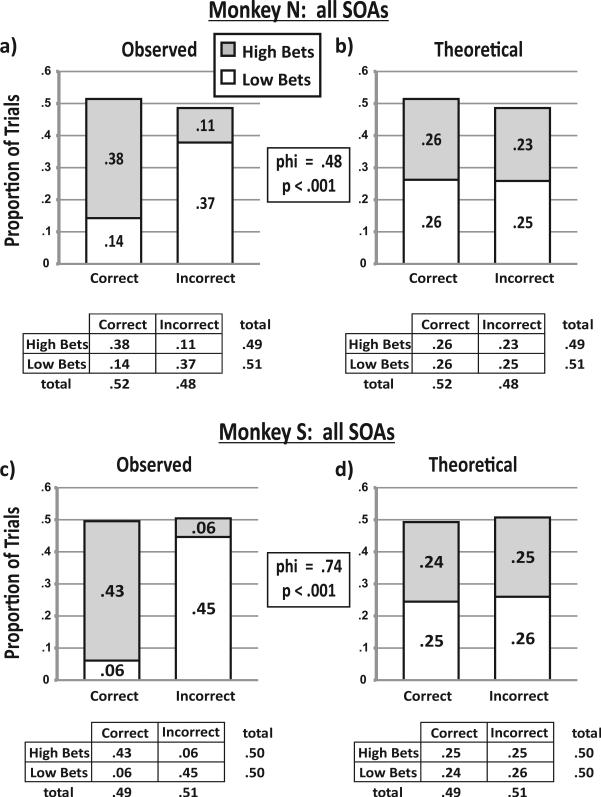
Figure 4.
Trial-by-trial analysis for all stimulus onset asynchronies (SOAs) combined. (a) The distribution of trial outcomes for Monkey N's trials combined. The bar graph shows the observed proportions of high bets (gray shading) and low bets (white shading) among correct and incorrect decisions. Below the bar graph, the table shows these same outcome proportions listed with the marginal totals. (b) Theoretical response rates if the monkey placed bets on the basis of an external variable (the SOA) rather than tracking its decisions. Note that the total proportion of high bets, low bets, correct decisions, and incorrect decisions are the same in Panels a and b. Chi-square between the distributions of Panels a and b indicate that they are significantly different (p < .001), with a phi correlation of .48. (c) The distribution of trial outcomes for all of Monkey S's SOA trials combined. As above, the bar graph shows the observed proportions of high bets (gray shading) and low bets (white shading) among correct and incorrect decisions. Below the bar graph, the table shows these same outcome proportions listed with the marginal totals. (d) Theoretical response rates if the monkey placed bets on the basis of an external variable (the SOA) rather than tracking its decisions. Note that the total proportion of high bets, low bets, correct decisions, and incorrect decisions are the same in Panels c and d. Chi-square between the distributions of Panels c and d indicate that they are significantly different (p < .001), with a phi correlation of .74. In the tables, some rows and columns do not add precisely to marginal distributions because of round-off error.

