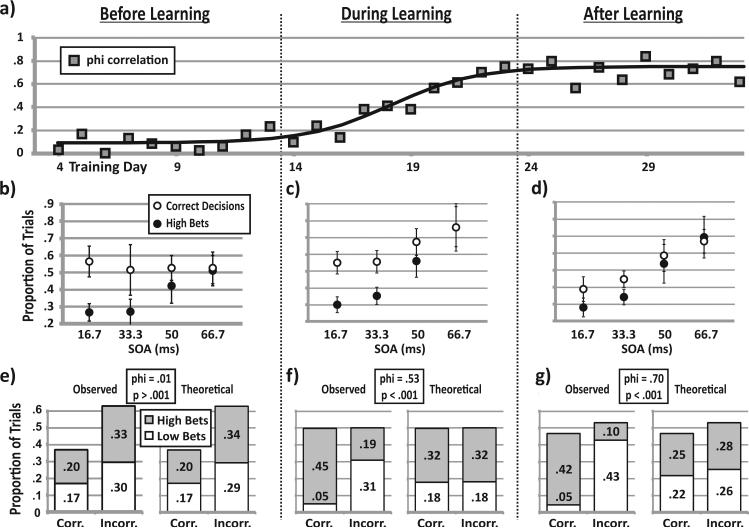
Figure 6.
Learning curves for Monkey S, divided into three stages. (a) Phi correlation (gray squares) measures how well the bets tracked the decisions on a trial-by-trial basis on Days 4–33 of training (x-axis). A sigmoid function fit the data (black line, R2 = .805, inflection point = 18.1 days). Panels b through d presents the average proportion of correct decisions (solid circles) and high bets (open circles) as a function of stimulus onset asynchrony (SOA) (b) before learning, (c) during learning, and (d) after learning to make bets based on decisions. Error bars represent standard deviations. Panels e through g present trial-by-trial analyses during each phase of learning: (e) The distribution of trial outcomes for Monkey S before learning for all trials combined. The bar graph shows the observed proportions of high bets (gray shading) and low bets (white shading) among correct (Corr.) and incorrect (Incorr.) decisions, as well as the theoretical response rates if the monkey placed bets on the basis of an external variable (the SOA) rather than tracking its decisions. Chi-square between the distributions of observed and theoretical proportions indicates that they are not significantly different (p > .001). The phi correlation is only .01. (f) The distribution of trial outcomes for Monkey S during learning for all trials combined. Chi-square between the distributions of observed and theoretical proportions indicates that they are significantly different (p < .001), with a phi correlation of .53. (g) The distribution of trial outcomes for Monkey S after learning for all trials combined. Chi-square between the distributions of observed and theoretical proportions indicates that they are significantly different (p < .001), with a phi correlation of .70.

