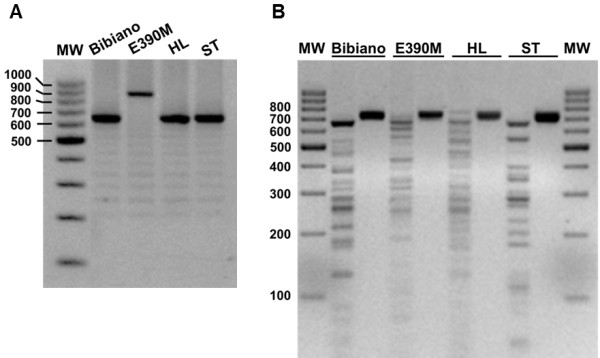
Figure 1.

Molecular characterization of L. infantum isolates. (A) Amplification of the k26 gene. See Additional file 3: Figure S2 for coding DNA sequences and alignment. (B) RFLP patterns for L. infantum isolates after HaeIII digestion of an amplified fragment of the minicircles kDNA. Profiles for DNA extracted from axenic promastigotes are shown, though DNA from experimentally infected murine tissues delivered comparable restriction patterns. For each strain, left lane corresponds to the digested DNA and right lane to undigested product. Gels were prepared with 2% (A) or 2.5% (B) agarose and stained with ethidium bromide. MW - molecular weight marker with bp units assigned in the left of the figure.
