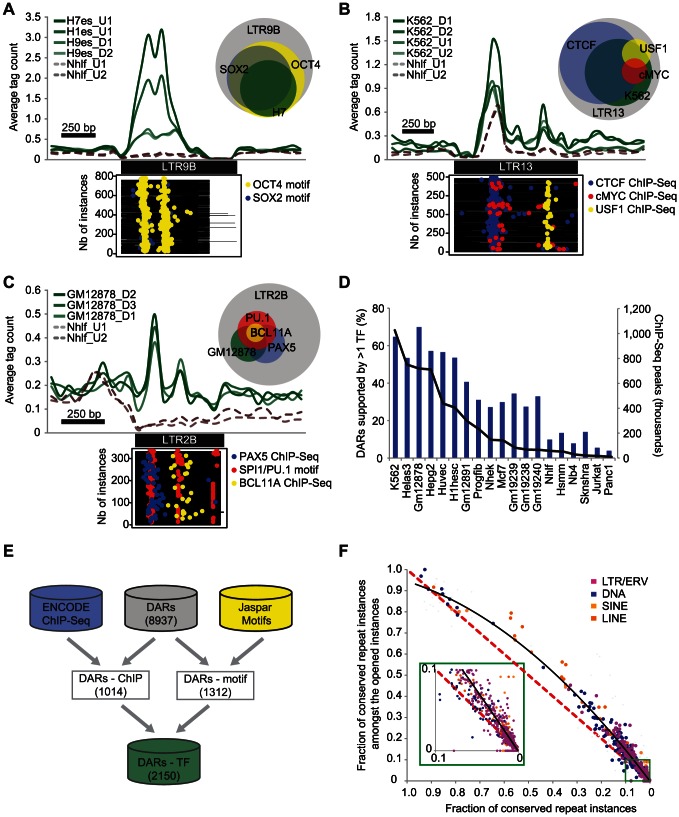
Figure 2. DARs are enriched for binding motifs, occupied by TFs, and show sequence conservation.
Aggregate profiles of DNase I tags (green) over the instances of different DARs: (A) LTR9B in ESC, (B) LTR13 in K562 and (C) LTR2B in GM12878. The profiles over another cell type (Nhlf) are shown as a control (dashed brown lines). The plots underneath the profiles represent the localization of regulatory motifs or ChIP-Seq peaks in the same cell lines (yellow, blue, red points). The Venn diagrams represent the proportion of repeat instances (grey) containing DHS and regulatory motifs or ChIP-Seq peaks using the same color code. (D) Proportion of DARs with at least one enriched TF (blue bars) and the total number of binding sites reported (black line) for each cell line. (E) Diagram showing the number of DARs supported by at least one TF based on ChIP-Seq or motif enrichment. (F) Scatterplot showing for each repeat subfamily, the fraction of conserved repeat instances amongst the opened instances. The black line represents a polynomial trend line of order 2. The red dashed line is the expected distribution.

