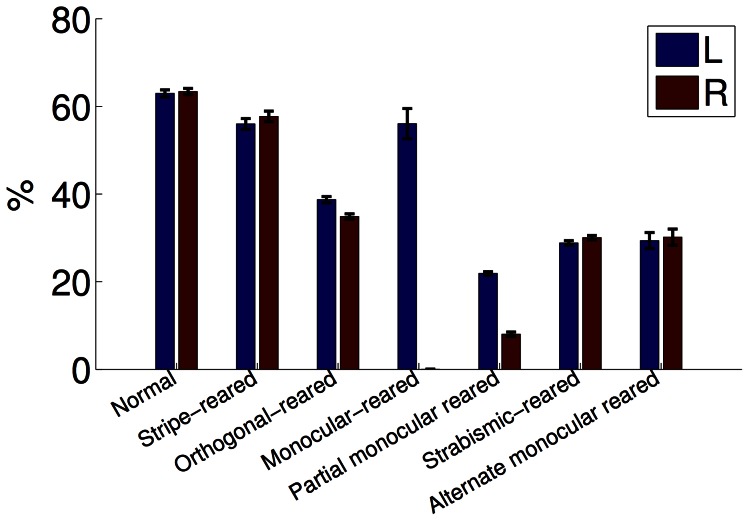
Figure 3. Orientation selectivity across rearing conditions (PoE model).
As in experiment, filtering the visual input resulted in a decrease in the fraction of orientation selective neurons (each eye shown separately). Neurons were considered selective when their circular variance was  [3]. Errorbars show the SEM. All modified rearing conditions had a significantly different fraction of orien- tation selective neurons compared with the normal condition (
 , Kolmogorov-Smirnov, each eye tested separately).

