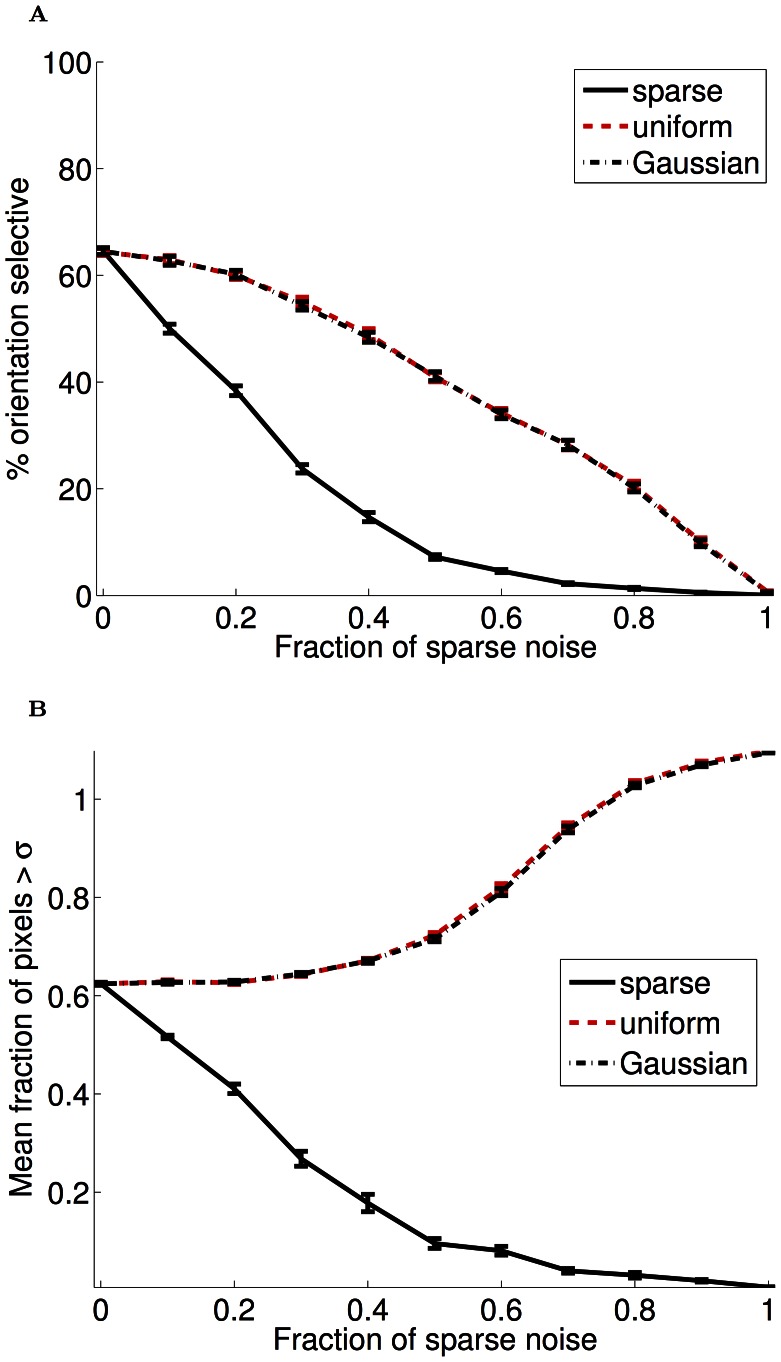
Figure 10. Quantification of receptive field changes with noise (PoE model).
(A) The fraction of orientation selective responses (defined as circular variance  0.6) as a function of the fraction of noise input during training (the remaining input always consisted of natural images). When sparse input constituted greater than 50% of the input, very little orientation selectivity remained. Uniform and Gaussian input also impacted the development of orientation selectivity; however, unlike sparse noise, this impact was more gradual. (B) To quantify the extreme localization that is visually apparent in the sparse noise receptive fields, we examined the fractions of weights in each receptive field that were more than 1 standard deviation from the mean of each filter. As with orientation selectivity, when sparse input constituted greater than 50% of the input to the model, most receptive fields were strongly localized to a small number of pixels. The opposite effect occurred with Gaussian and uniform noise, presumably because this input impaired the convergence of the model.

