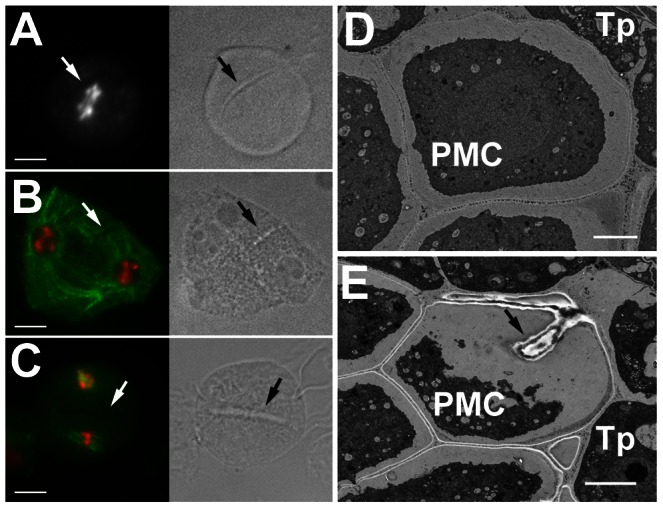
Figure 3. Ectopic cell wall-like structures in cycb3;1 mutants.

(A–C) PMCs from cycb3;1 plants visualized by epifluorescence (left panel) and bright field (right panel) microscopy. DNA is counterstained with DAPI (white in A, red in B,C), microtubules (green in B,C) were detected with anti-α-tubulin antibody. (A) early anaphase I, (B) interkinesis, (C) metaphase II. Bars = 10 µm. (D,E) Section through anthers with PMCs in late meiosis I visualized by transmission scan electron microscopy. Arrows indicate ectopic cell wall-like structures, c – callose, Tp – tapetum cells. Bars represent 3 µm.
