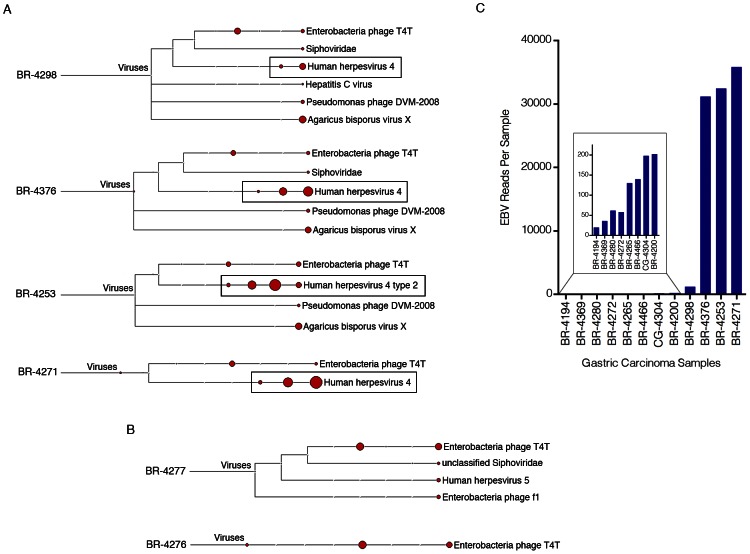
Figure 1. Detection of EBV in gastric carcinoma samples.
Four gigabytes of deduplicated RNA-seq read data from each of the seventy-one gastric carcinoma samples were analyzed using RNA CoMPASS. The virome branch of the taxonomy trees for the four samples with the highest number of EBV reads (A) and two EBV-negative samples (B) were generated using the metagenome analysis tool, MEGAN 4. (C) For a more in depth analysis of EBV reads, the combined sequence read files for each sample were aligned to the EBV genome and the hg19 human genome assembly using the genome aligner, Novoalign. Of the EBV-positive samples, four samples were identified as having high numbers of EBV reads while eight were found to have low but detectable numbers of EBV reads (see Figure S2 for plot of EBV reads per 1,000,000 human mapped reads).

