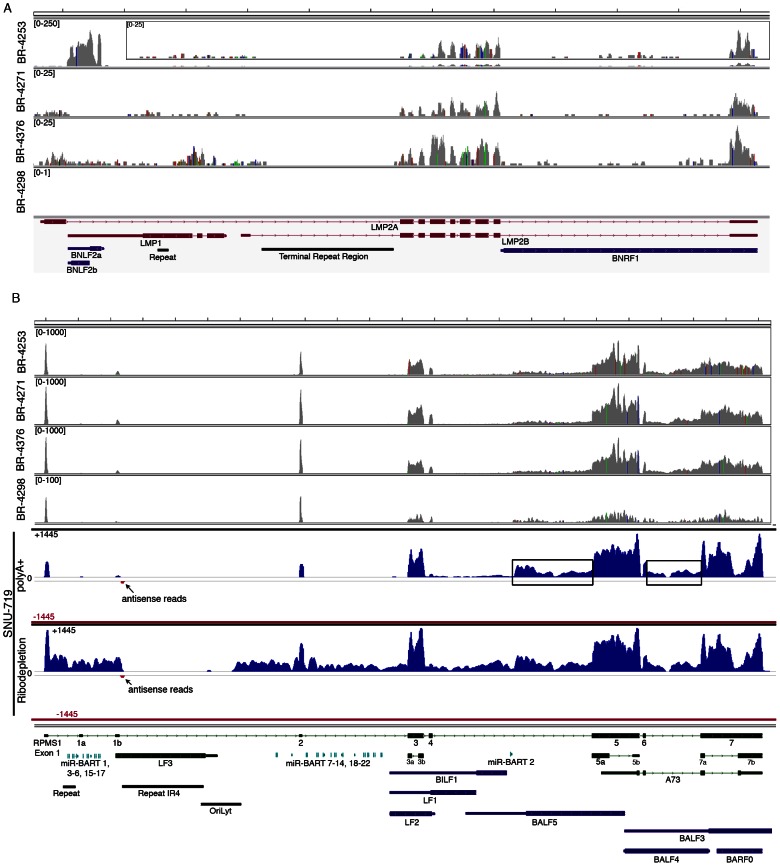
Figure 4. EBV gene expression analysis.
Detailed read coverage data for the LMP2a, LMP1, and BNLF2a/b genes (A) and the RPMS1/BamHI A regions (B) of the EBV genome. Data was displayed using the Integrative Genomics Viewer (IGV) using the modified B95-8 genome containing Raji genome sequences (Genbank accession number AJ507799). The y axis represents the number of reads at each nucleotide position of the genome. Blue features represent lytic genes, red features represent latency genes, green features represent potential non-coding genes, aquamarine features represent microRNAs, and black features represent non-gene features (repeat regions and origins of replication, for example). In panel (A), coverage graphs for BR-4253 is scaled to a maximum read level of 250 reads (the BR-4253 inset displays the data with a max read level of 25), the BR-4271 and BR-4376 graphs are scaled to a max read level of 25, while the max read level for BR-4298 is 1. For coverage across the RPMS1/BamHI A region (B), BR-4253, BR-4271, and BR-4376 are scaled to 1,000 reads, while BR-4298 is scaled to 100. Strand specific sequencing from SNU-719 cells of the RPMS1/BamHI A region is also displayed. The top 2 tracks are from poly(A) selected RNA and the bottom 2 tracks are from Ribo-Zero depleted RNA. The read coverage for the sense strand is displayed in blue with positive values while the antisense strand is displayed in red with negative values. The scale is + or −1,445 reads for the sense and antisense strands.

