
Figure 5. EBV transcripts from RPMS1 are among the highest expressed genes in EBVaGCs.
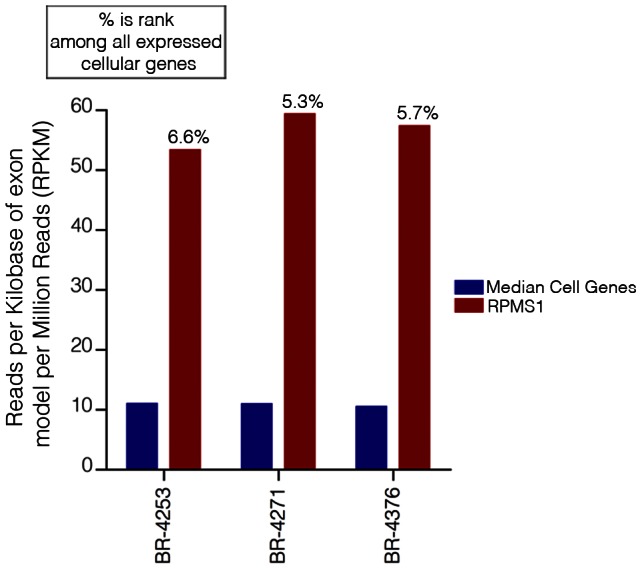
RPKM values calculated using reads across all RPMS1 exons are shown with respect to the median expression of all expressed cellular genes (expressed genes defined as cellular genes with greater than 1 RPKM). The percentage values above each RPMS1 bar represents the rank of RPMS1 expression in the respective sample among all expressed cellular genes in that sample.