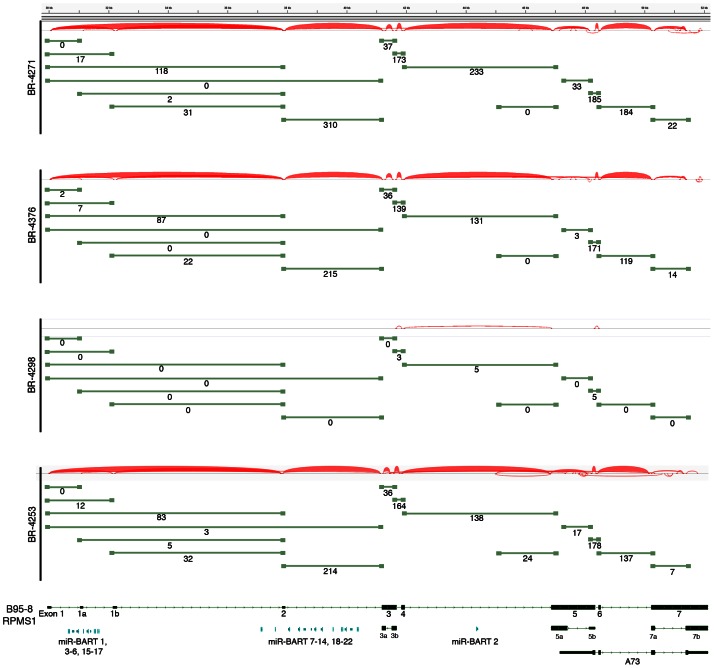
Figure 6. Alternative splicing in the EBV BamH1 A region in EBVaGCs.
RNA-seq data from BR-4271, BR-4376, and BR-4298 and BR-4253 was analyzed using the TopHat aligner to obtain splice junction information. Samples with the type I strain of EBV, BR-4271, BR-4376, BR-4298, and BR-4253 were aligned to the type I genome, B95-8/Raji (Genbank accession number AJ507799). Junctions were visualized using Integrative Genomic Viewer (IGV) [88]. Thickness of red junction features correlates with the number of reads for the respective junction. The number of junction spanning reads for each junction is indicated below each olive green junction feature.

