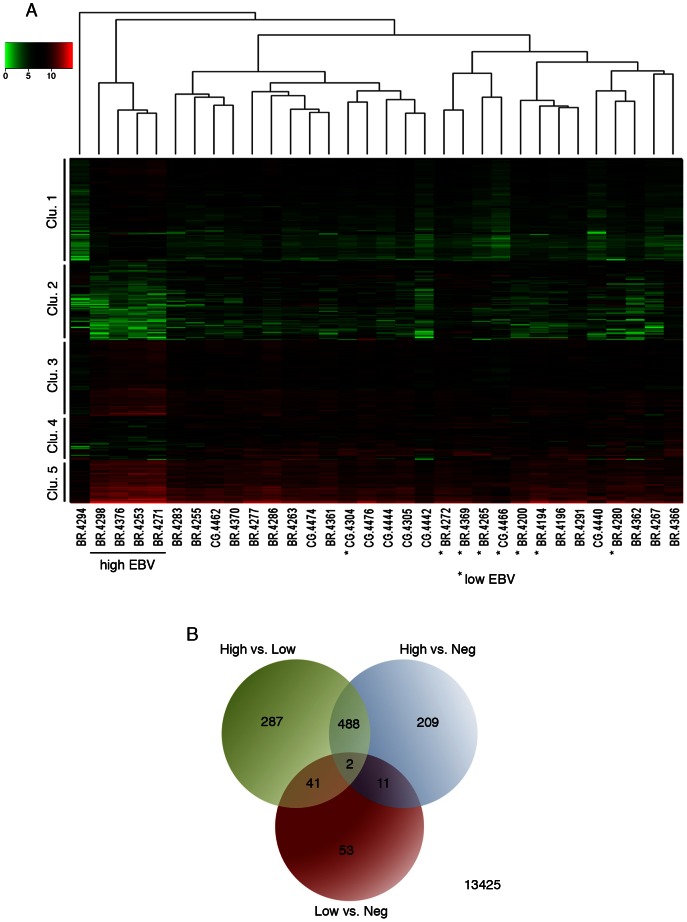
Figure 7. Cluster analysis of EBV-associated gastric carcinoma samples.
(A) A representative cohort of 32 gastric carcinoma samples (12 EBV-positive and 20 EBV-negative) were grouped using hierarchical clustering and are displayed with an expression heat map of the 490 genes that were found to be significantly differentially expressed in high EBV. (B) The cohort of 32 gastric carcinoma samples was divided into three categories (high EBV, low EBV, and negative). These categories were subjected to differential gene expression analysis using edgeR. The Venn diagram displays the numbers of all statistically significant differentially expressed genes. Statistical significance was determined by an adjusted P value<0.05.

