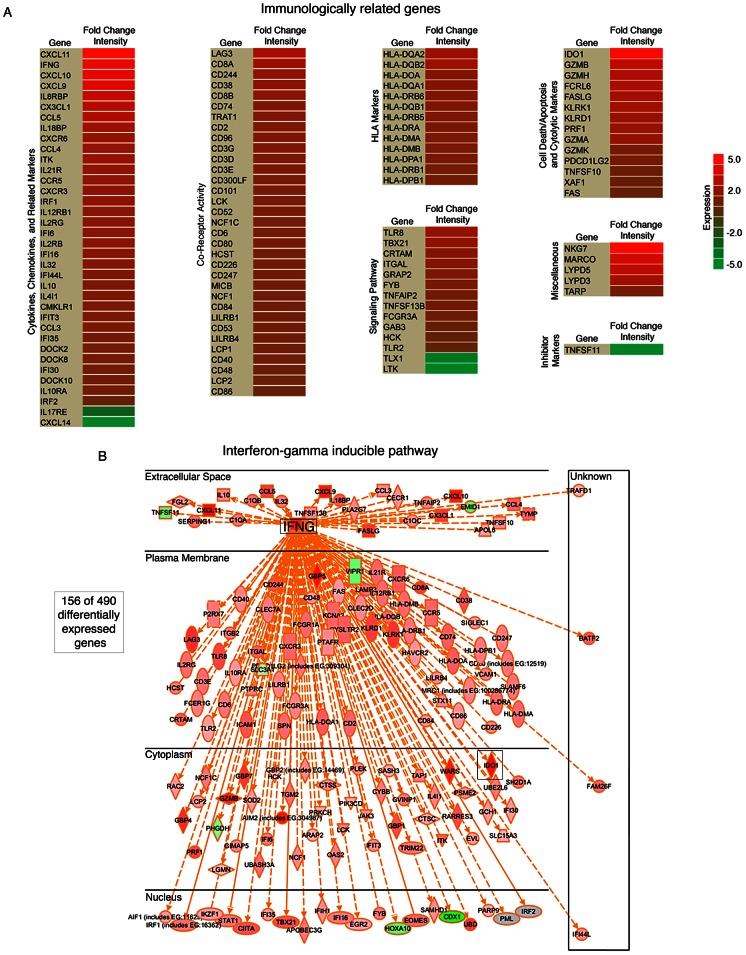
Figure 8. High numbers of infiltrating immune cellular genes are detected in EBVaGC.
(A) Significant immunologically related genes differentially expressed in EBVaGC are represented in a heat map. The log2 fold change intensities are represented by the color gradient with red corresponding to the highest intensity and green corresponding to the lowest. (B) Interferon-gamma (IFNG) associated genes differentially expressed in EBVaGC are displayed in a diagram.

