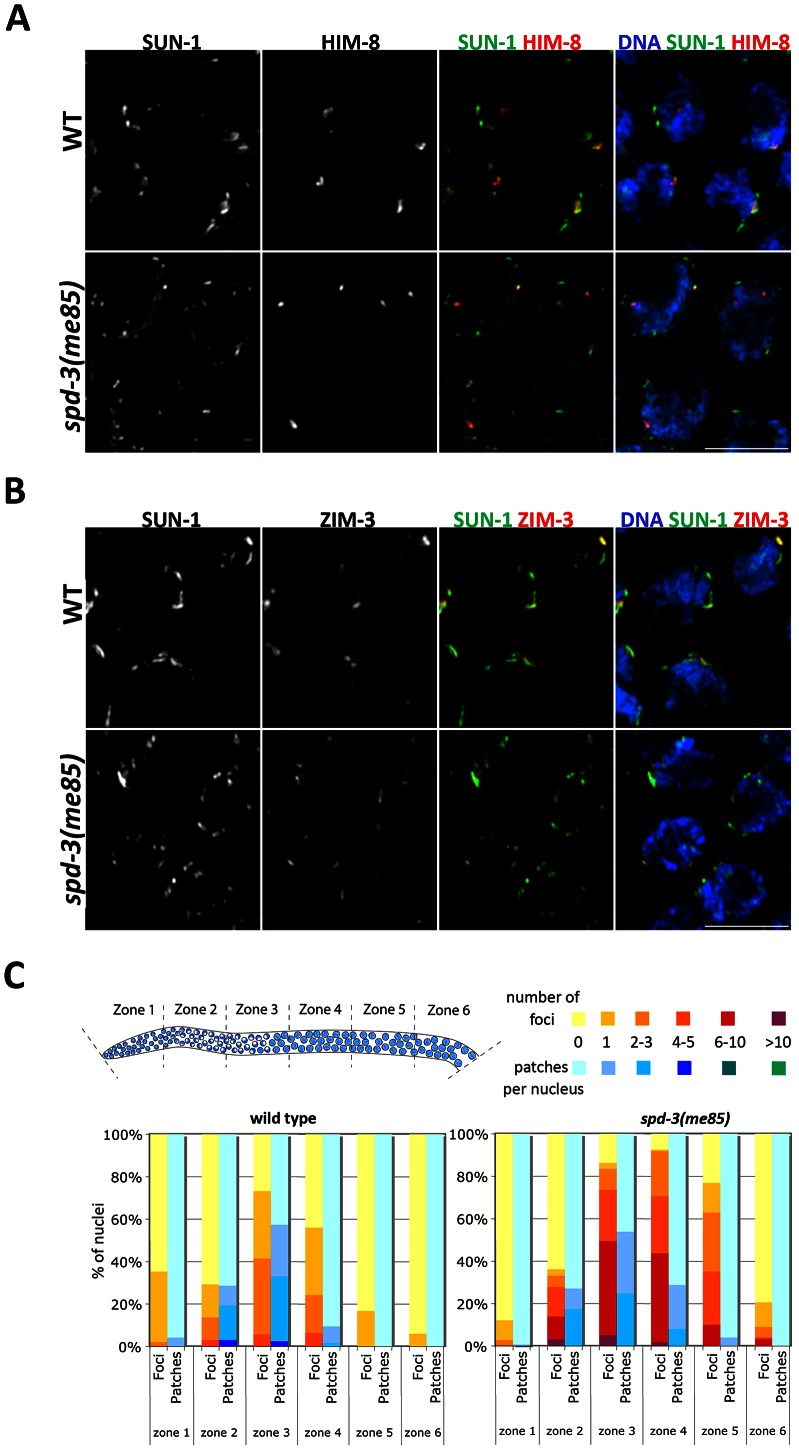
Figure 4. Localization of PC proteins to the NE in spd-3(me85) mutants.
(A–B) Projections of transition zone nuclei from wild type and spd-3(me85) mutant worms expressing SUN-1::GFP and stained with anti-HIM-8 and anti-ZIM-3 antibodies and counterstained with DAPI. HIM-8 and ZIM-3 signals are associated with SUN-1 aggregates in both wild type and spd-3(me85) mutant, which display elevated numbers of SUN-1 aggregates. Videos S1 and S2 show three-dimensional reconstructions of nuclei from panel A. Scale bar = 5 µm in both panels. (C) Quantification of SUN-1 aggregates. Y axis indicates the percentage of nuclei with a given number of SUN-1 foci (aggregates smaller that 1.1 µm in diameter) or patches (aggregates larger than 1.1 µm in diameter), the X axis indicates regions along the germ line as indicated in the diagram. Note the big increase in SUN-1 foci in spd-3(me85) mutant and their persistence until mid/late pachytene.

