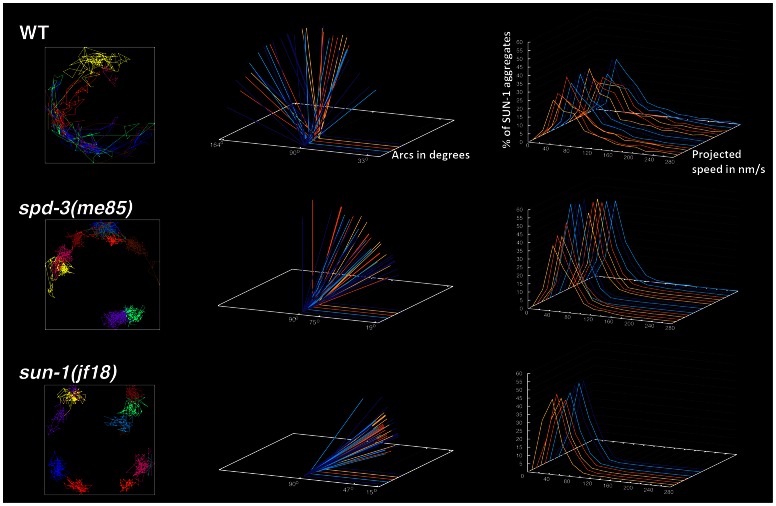
Figure 6. spd-3(me85) mutants display reduced mobility of SUN-1 aggregates.
Left-hand side column: examples of the displacement tracks of all SUN-1::GFP aggregates within a nucleus over a period of 15 minutes. spd-3(me85) and sun-1(jf18) mutants show obvious reductions in both the area explored by SUN-1::GFP aggregates and in the overlap of different tracks. Middle column: each arc represents the distance traveled by a SUN-1::GFP aggregate inside a nucleus, with larger angles indicating larger distance traveled. Arcs corresponding to all SUN-1 aggregates from 5 nuclei are shown per genotype, arcs are severely reduced in spd-3(me85) mutants, although not as much as in sun-1(jf18) mutants. Right-hand column: Each line represents the distribution of the projected speeds of all SUN-1 aggregates inside a nucleus over a period of 15 minutes. spd-3(me85) and sun-1(jf18) mutants show a strong reduction in the percentage of SUN-1 aggregates moving at high speeds.

