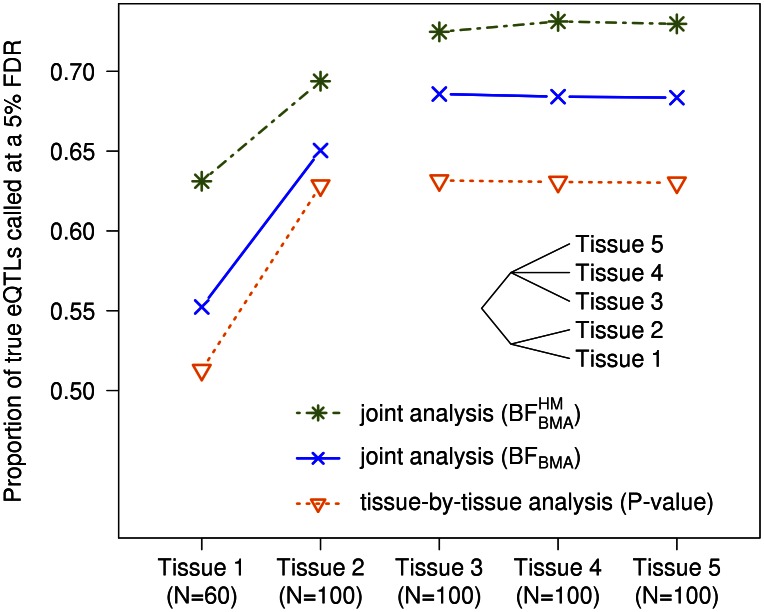
Figure 2. The  joint analysis efficiently borrows information across genes.
Five tissues are simulated. Some eQTLs were shared by all tissues, some were specific to each tissue, and, as depicted by the cladogram, some were shared by Tissues 1 and 2 only, while others were shared by Tissues 3, 4 and 5. Each tissue has 100 samples, except tissue 1 which has only 60.

