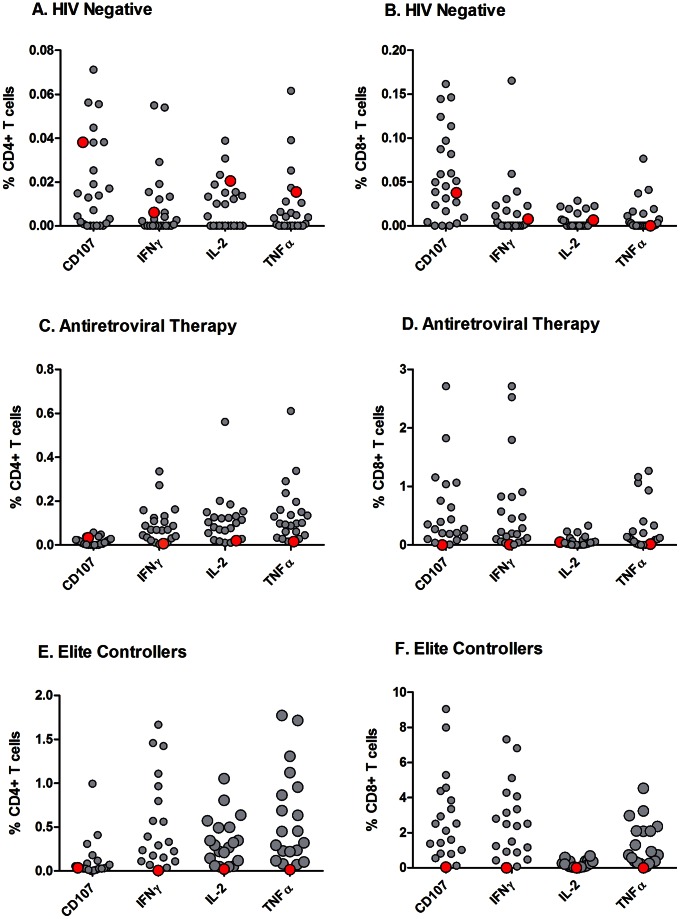
Figure 4. HIV Gag-specific cell mediated immune responses.
PBMC were obtained from the Berlin Patient (solid red circles), HIV-uninfected adults (open black circles in 4A–B), chronically HIV-infected adults on long term ART with undetectable plasma viral loads (open black circles, 4C–D), and elite controllers (open black circles, 4E–F). PBMC were stimulated with CMV pp65 or HIV Gag peptide pools, and flow cytometry was used to measure the percentage of CD4+T cells (4A, 4C, 4E) or CD8+T cells (4B, 4D, 4F) with intracellular staining for interferon-γ, tumor necrosis factor-α, IL-2, or CD107. The y axis shows the percent of T cells that express each cytokine in response to HIV Gag. The solid red circle indicates the Berlin Patient, while open black circles indicate individuals from comparator groups.

