
Figure 5. Electrostatic analysis of the binding surfaces involved in interaction between RV6-26 Fab and VP6.
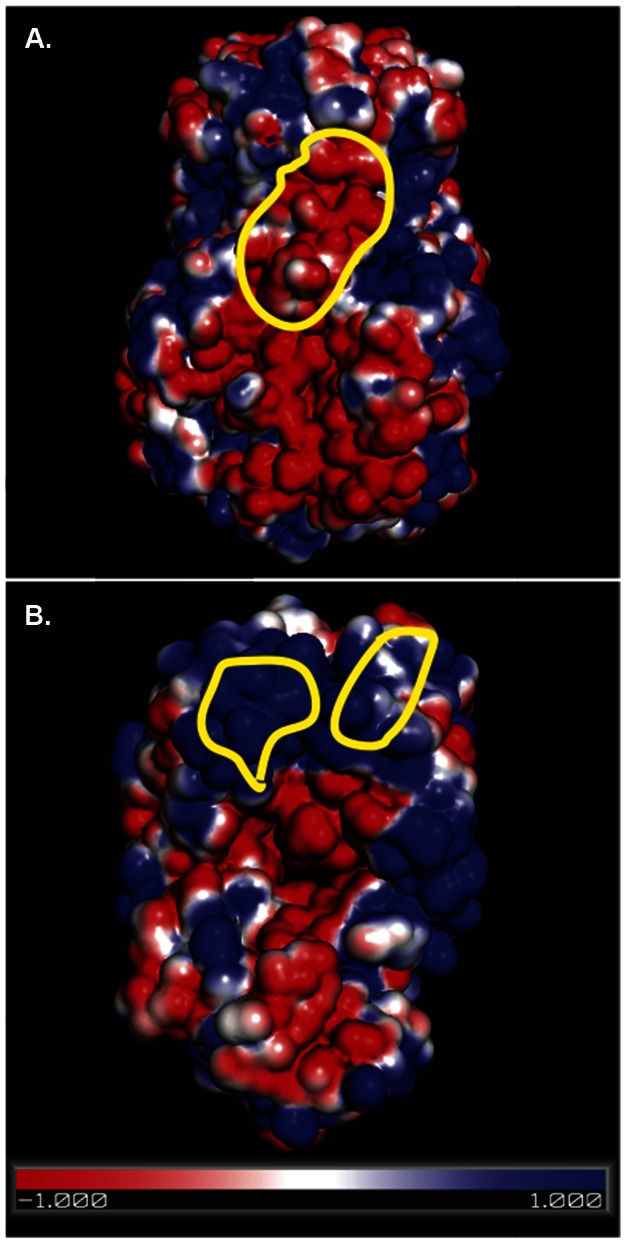
The surface electrostatic potential of the VP6 trimer (A), lateral view, or the RV6-26 Fab (B), with red or blue for negative or positive charges, respectively. The yellow circles indicate region B of the VP6 epitope (A) and the heavy and light chain elements of the paratope on Fab RV6-26 (B), as defined by DXMS analysis. See also Figure S2 in File S1 for RV6-26 paratope, as determined by DXMS.