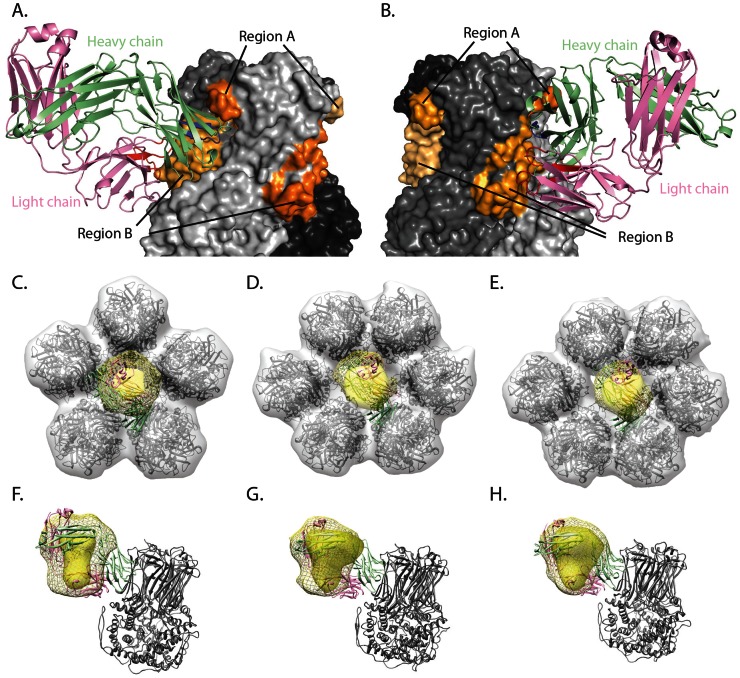
Figure 6. Computer-generated model of VP6-RV6-26 conformation and comparison to predicted epitope regions and cryo-EM density maps.
The model was generated with RosettaDock, using DXMS-predicted epitope and paratope regions as restraints during docking. (A) RV6-26 bound to VP6 at a quaternary epitope made up of region A on one VP6 protomer and region B of a second VP6 protomer. Shades of gray represent the three protomers that make up the VP6 trimer, and the shades of orange represent the DXMS-predicted epitope regions mapped on each protomer. Heavy and light chains are green and violet, respectively. DXMS-predicted paratope regions for heavy and light chain are colored blue and red, respectively. (B) Horizontal rotation of frame A. (C–E) Fit of representative model into experimental and simulated cryo-EM density of Type I, II, & III channels, respectively. Density attributed to Fab is yellow with simulated Fab density shown as mesh. Experimental VP6 density is gray (simulated density not shown). Cryo-EM density is overlaid on VP6 crystal structure (PDB-ID 3KZ4). Fab interacting with a single VP6 trimer is displayed as cartoon with light chain colored pink and heavy chain colored green. (F–H) Side view of experimental and simulated Fab density for Type I, II, and III channels, respectively, with coloring as in frame C–E.

