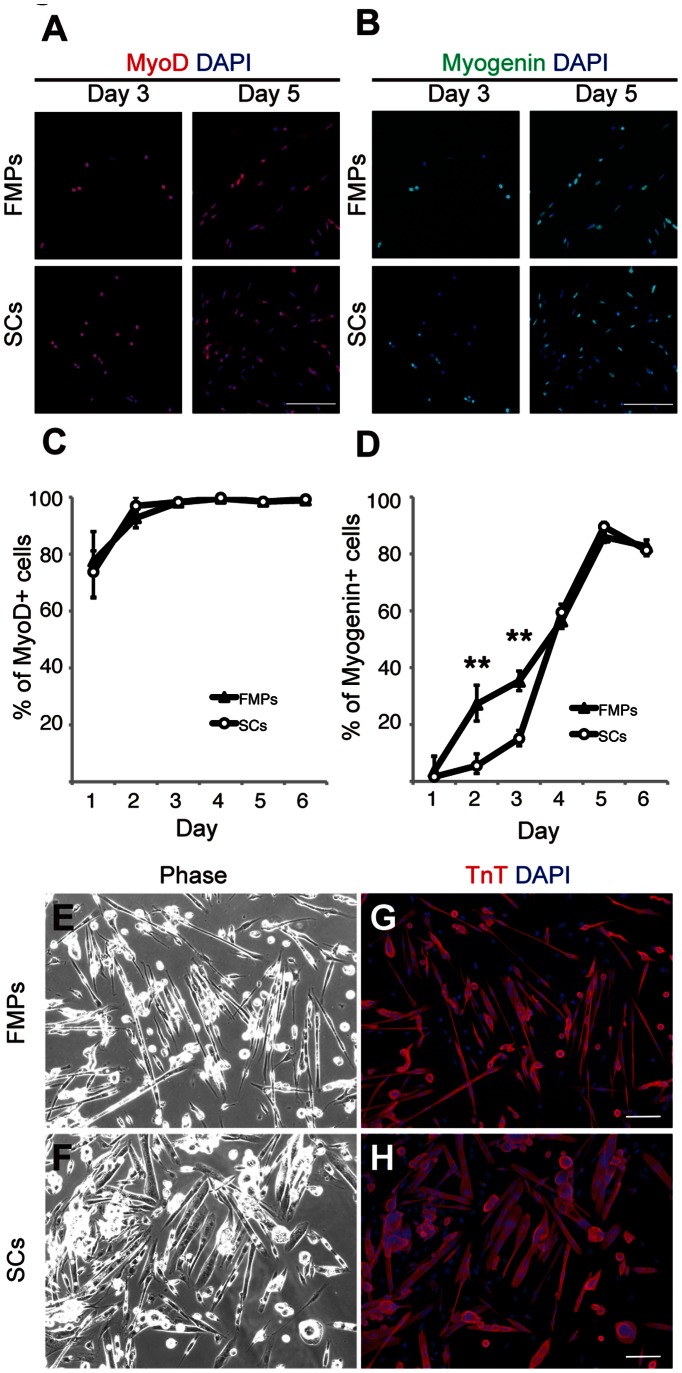
Figure 2. FMPs and SCs show similar myogenic differentiation potential in vitro.
(A,B) Immunocytochemistry of FMPs and SCs for MyoD (A) and Myogenin (B) during culture (days 3 and 5). DAPI was used for to stain nuclei. Scale bar = 50 µm. (C,D) Quantitative analysis of MyoD (C) and Myogenin (D) in cultured FMPs and SCs. Data are reported as mean and s.d. of 500–1000 cells per staining from three independent experiments. P-values indicated on figures are <0.01 (**). (E,F) Phase contrast micrographs of FMPs (E) and SCs (F) after 7 days in culture. (G,H) Immunocytochemistry of FMPs (G) and SCs (H) shown in (E,F) for Troponin T and DAPI. Scale bar = 50 µm. FMPs, fetal skeletal muscle progenitors; SCs, satellite cells.

