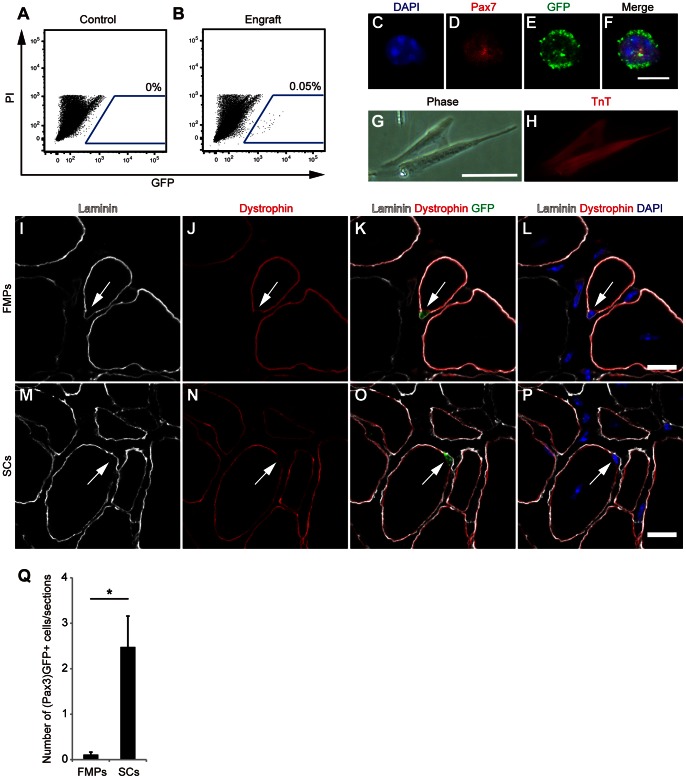
Figure 4. Recovery of (Pax3)GFP+ cells from FMP- and SC-engrafted TA muscles.
(A,B) A representative fluorescence-activated cell sorting profile for (Pax3)GFP+ cells from control (A) and FMP-engrafted (B) TA muscle. The percentage of cells that express GFP is indicated. (C–F) Immunocytochemistry for Pax7 (D) and GFP (E) of freshly isolated (Pax3)GFP+ cells from FMP-engrafted TA muscles. Scale bars = 5 µm. (G,H) Phase contrast micrographs (G) and immunocytochemistry with anti-Troponin T antibodies (H) of isolated (Pax3)GFP+ cells cultured in proliferation and differentiation conditions for 6 days. Scale bar = 50 µm. (I–P) Immunostaining for laminin, dystrophin, and GFP in TA muscles of DMD-null mice injected with FMPs (I–L) and SCs (M–P) 2 weeks after intramuscular engraftment. Arrows indicate (Pax3)GFP+ cells underneath laminin and outside of dystrophin. Scale bar = 10 µm. (Q) Quantification of (Pax3)GFP+ cells underneath laminin and outside of dystrophin in TA engrafted with FMPs (n = 5 recipient mice) and SCs (n = 5 recipient mice). Data is reported as the mean and s.e.m. from all engrafted mice. P-value indicated on the figure is <0.05 (*). FMPs, fetal skeletal muscle progenitors; SCs, satellite cells; TA, tibialis anterior.

