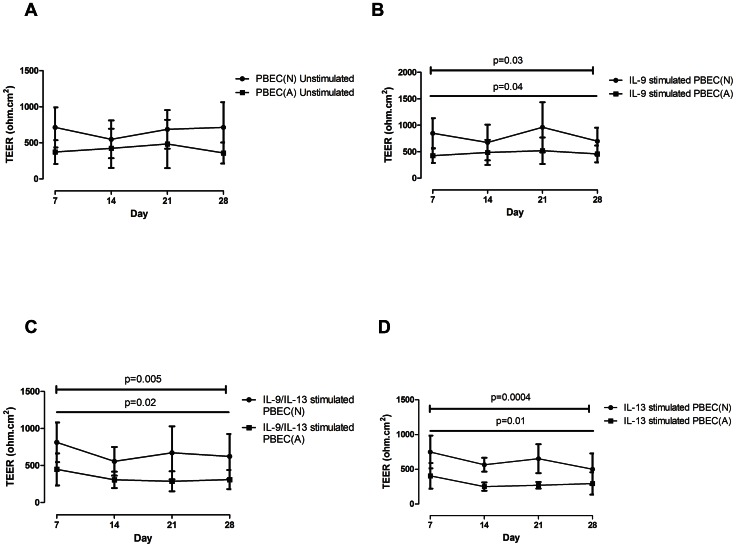
Figure 8. TEER values of PBEC(N) and PBEC(A) under stimulation with IL-9, IL-9/IL-13 combination and IL-13.
Values are expressed as mean (error bar represents 1 SD) (straight line depicts analysis over Time; barred line depicts analysis between Clinical (Normal versus Asthmatic)). (A) TEER values between PBEC(N) and PBEC(A) displayed no significant differences under unstimulated conditions over time, between clinical phenotype (Normal versus Asthmatic) or by interaction (ie/. does PBEC(A) behave differently from PBEC(N) over time). (B) TEER values under stimulation with IL-9 demonstrated a significant reduction between PBEC(N) and PBEC(A) over time (Time p = 0.04) and between clinical (Clinical p = 0.03), however not by interaction (Interaction p = 0.09). (C) TEER values under stimulation with IL-9/IL-13 combination demonstrated a significant reduction between PBEC(N) and PBEC(A) over time (Time p = 0.02) and between clinical (Clinical p = 0.005), however not by interaction (Interaction p = 0.7). (D) TEER values under stimulation with IL-13 demonstrated a significant reduction between PBEC(N) and PBEC(A) over time (Time p = 0.01) and between clinical (Clinical p = 0.0004), however not by interaction (Interaction p = 0.4).

