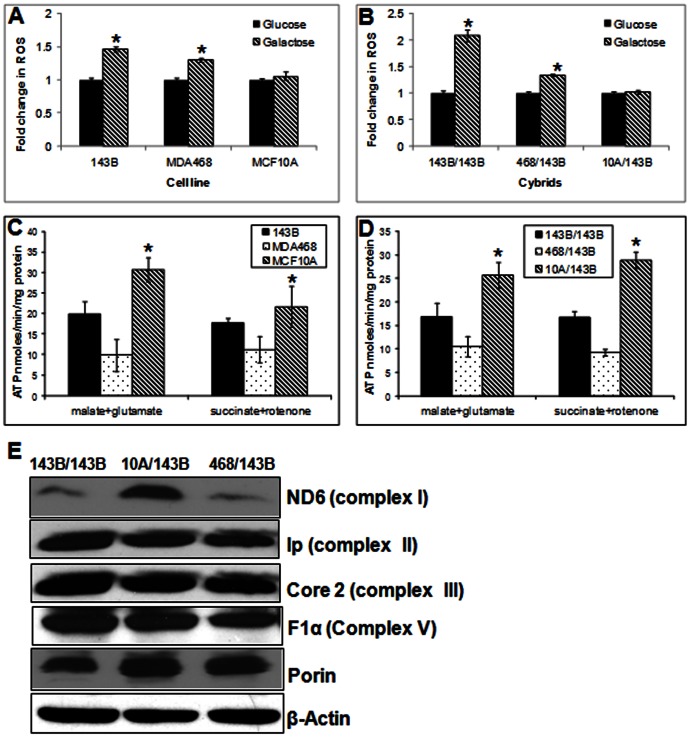
Figure 1. ROS production and ATP synthesis.
(A) ROS production in parental cells. After Cells were grown in DMEM-glucose or DMEM-galactose medium for 24 h and ROS were measured using DCFH-DA fluorescent dye. Data expressed as DCF fluorescence/mg protein. (B) ROS production in cybrid cells. (C) Mitochondrial ATP synthesis rate in parental cells. ATP synthesis was driven by complex I substrates (glutamate plus malate) or complex II substrate (succinate) in the presence of complex I inhibitor (rotenone). The rates of ATP synthesis are expressed as nmoles ATP/min/mg protein. (D) Mitochondrial ATP synthesis rate in cybrids. (E) Western blot analysis of representative protein subunits of the mitochondria respiratory complexes in cybrids. β-actin and porin were used as loading controls for nuclear and mitochondria proteins respectively. (* = P<0.05).

