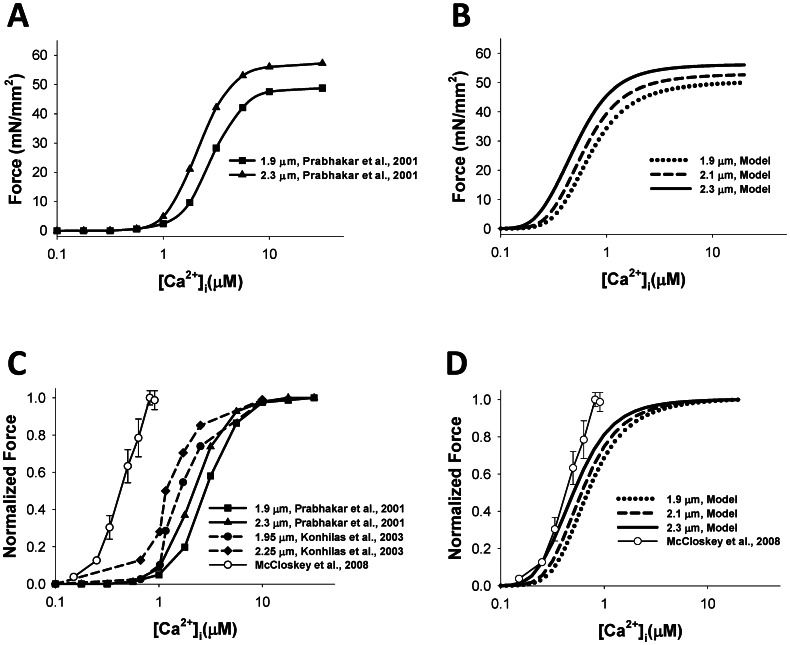
Figure 2. The steady-state [Ca2+]i-force relationship.
The steady-state [Ca2+]i-absolute force relationship (A and B) and the normalized steady-state [Ca2+]i-force relationship (C and D). Experimental data from Prabhakar et al. [23] (SL = 1.9 and 2.3 µm) and Konhilas et al. [25] (SL = 1.95 and 2.25 µm), obtained with skinned myocytes, are shown in (A) and (C) with filled symbols; experimental data for non-skinned myocytes from [26] is shown by unfilled circles in (C) and (D). The model’s simulations at various initial sarcomere lengths (SL = 1.9, 2.1, and 2.3 µm) are shown in (B) and (D). Simulated data for both epicardial and endocardial cells are the same.

