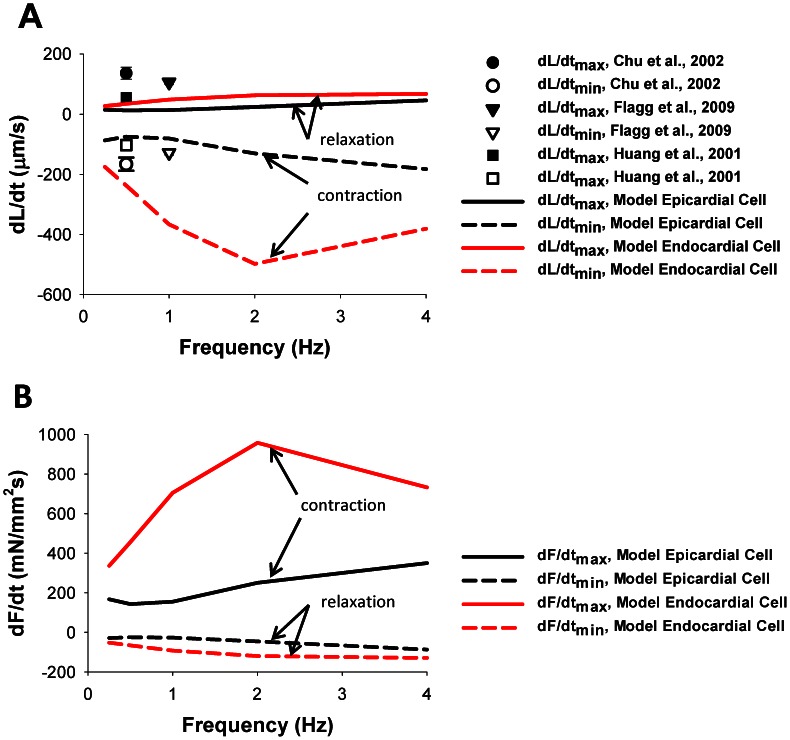
Figure 9. Frequency dependence of dL/dtmax and dF/dtmax.
(A) The simulated frequency dependences of (+dL/dt)max (solid lines) and (−dL/dt)max (dashed lines). Experimental data from Chu et al. [37], Flagg et al. [38], and Huang et al. [32] are shown by symbols. We consider (−dL/dt) to correspond to cell shortening. (B) The simulated frequency dependence of (+dF/dt)max (solid lines) and (−dF/dt)max (dashed lines). We consider (+dF/dt) to correspond to contraction. The initial SL for the simulations in (A) and (B) is 2.1 µm. Data for epicardial and endocardial cells are shown in black and red, respectively.

