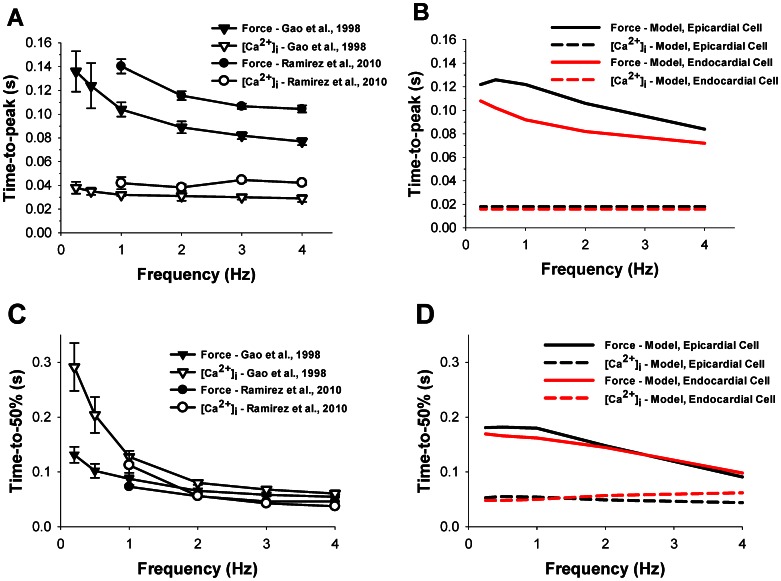
Figure 10. Time-to-peak and time-to-50% relaxation of the contraction force and [Ca2+]i transients as function of stimulation frequency.
Experimental (A) and simulated (B) frequency dependencies of time-to-peaks for intracellular [Ca2+]i transients and contraction force, and experimental (C) and simulated (D) frequency dependencies of time-to-50% relaxations for intracellular [Ca2+]i transients and contraction force. Experimental data are obtained by Gao et al. ([27], triangles) and Ramirez et al. ([45], circles). Unfilled and filled symbols are used for intracellular [Ca2+]i transients and contraction force, respectively. Simulation data for contraction force and intracellular [Ca2+]i transients are shown by solid and dashed lines, respectively, and data for epicardial and endocardial cells are shown in black and red, respectively.

